A scatter plot is a data visualization that displays the values of two different variables as points. The data for each point is represented by its horizontal (x) and vertical (y) position on the visualization. Additional variables can be encoded by labels, markers, color, transparency, size (bubbles), and creating ‘small multiples’ of scatter plots. Scatter plots are also known as scatterplots, scatter graphs, scatter charts, scattergrams, and scatter diagrams.
Don’t forget you can create a scatterplot for free using Displayr’s scatterplot maker!
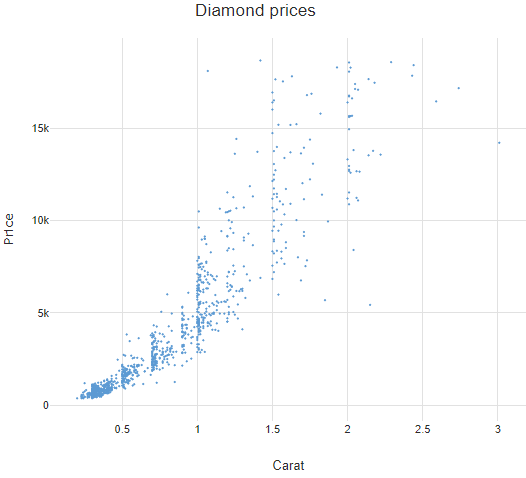
In the example below, each dot represents a diamond, with the horizontal position showing the carat (size) of the diamond and vertical position showing the price of the diamond.
Required data
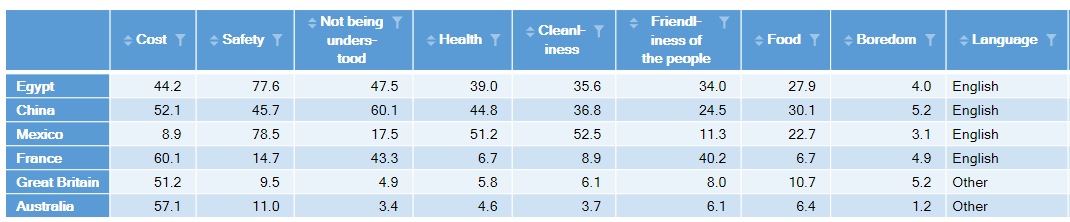
A scatter plot displays data for a set of variables (columns in a table), where each row of the table is represented by a point in the scatter plot. The variables can be both categorical, such as Language in the table below, and numeric, such as the various scores assigned to countries in the table below.
Different types of scatter plots
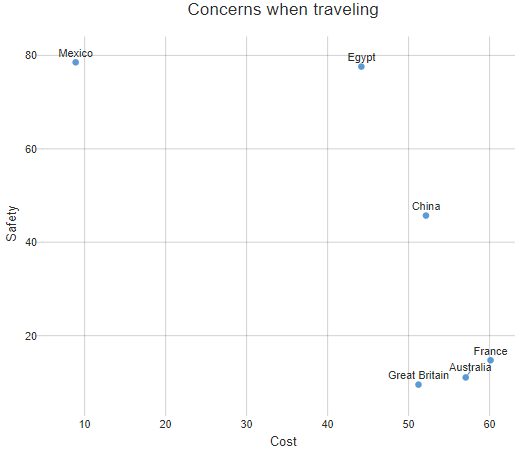
Labeled scatter plots
A labeled scatter plot uses text to identify each point of data, as shown below.
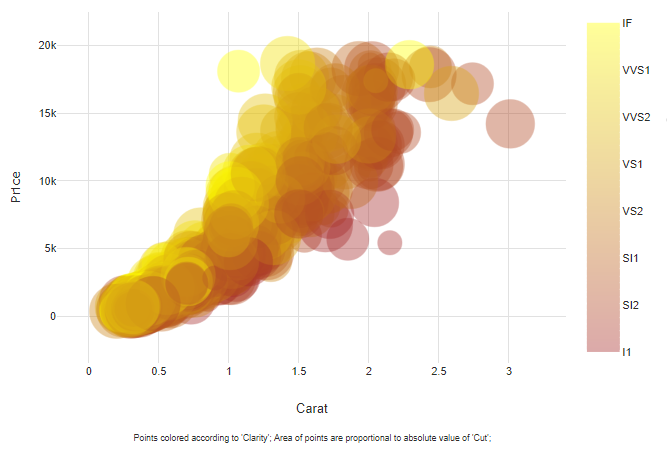
Bubble charts
A bubble chart shows additional information by the size of the circle. In th example below, the area of each circle indicates the quality of the cut (bigger circles have higher cut qualities), and color indicates the clarity of the diamond, with yellow bubbles having superior quality. As with the scatter plot at the beginning of this post, we can see that larger carat diamonds have higher prices, on average. However, we can also see that the price among diamonds of similar carats, those with higher clarity get higher prices (i.e., the yellow bubbles are generally higher than the reddish bubbles).
Small multiples, including scatter plot matrices
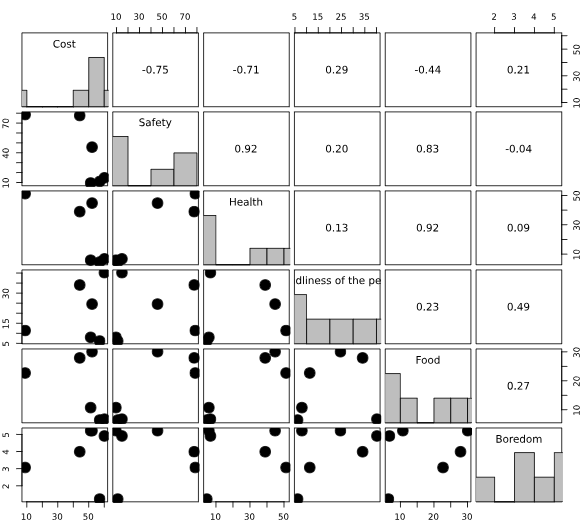
A small multiple of scatter plots is a set of related scatter plots shown in a table. Most commonly, this is a scatter plot matrix (SPLOM), where each plot shows a correlation between a pair of variables. The SPLOM below shows the numeric data from the table earlier in this article. The distribution of each of the numeric variables is shown by the histograms in the main diagonal of the plot. The correlations are shown above the main diagonal and the scatter plots below the main diagonal.
Scatter plots with smoothers (lines of best fit)
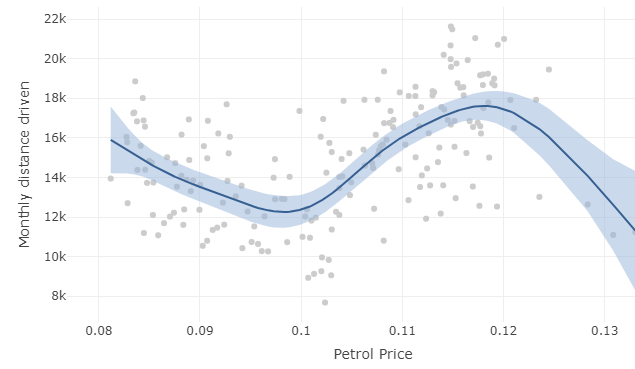
Lines of best fit are often added to scatter plots to make it easier for the viewer to discern the average relationship between the x and y variables. Where these lines are permitted to be curved, they are known as smoothers. In the example below, a confidence band has also been shown to indicate the uncertainty regarding the estimate of the line of best fit.
The overplotting problem
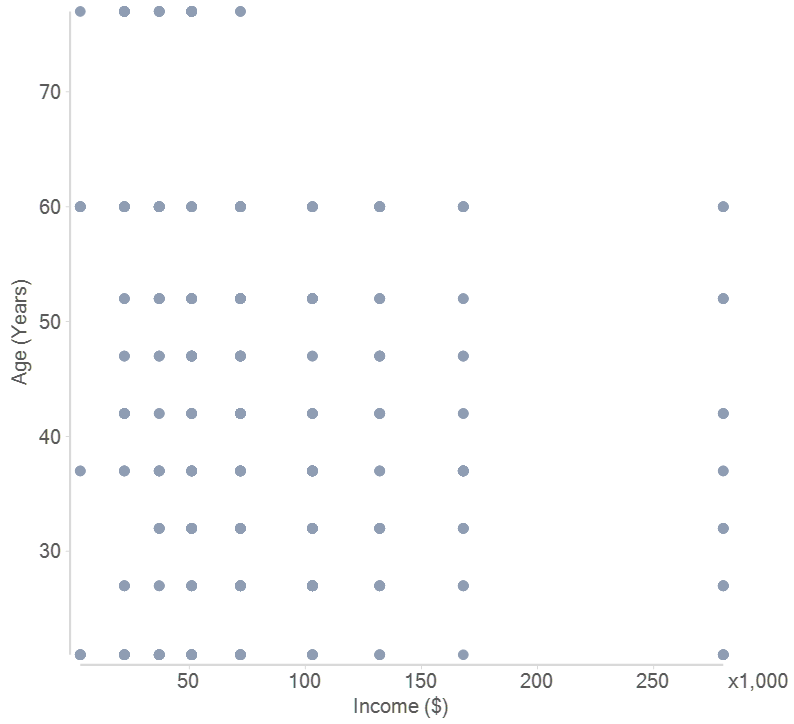
The scatter plot below shows age by income. This visualization exhibits the telltale sign of overplotting, which is that the data appears in neat rows and columns. There is no way to determine from this visualization if, say, there is only one person aged 60 with an income of $50,000 or more. See “What is Overplotting” for a discussion of different causes and remedies for overplotting.
Scatter Plot Best Practices
A well-designed scatter plot makes it easy to identify patterns, trends, and correlations in your data. To ensure clarity and effectiveness:
- Label axes clearly – Use descriptive labels with appropriate units so the reader immediately understands what’s being compared.
- Use consistent scaling – Keep axis scales proportional to avoid distorting relationships between data points.
- Add a trend line if helpful – A regression line can highlight overall patterns without overwhelming the plot.
- Use color and size strategically – Different colors or point sizes can help distinguish categories, but avoid excessive clutter.
- Minimize overplotting – If data points overlap too much, use transparency or jittering to maintain readability.
Common Issues to Avoid
Even simple scatter plots can be misleading if not designed carefully. Watch out for:
- Skewed perceptions due to axis manipulation – Truncated or uneven scales can exaggerate trends that aren’t actually significant.
- Cluttered visuals – Too many data points without proper spacing or transparency can make insights harder to see.
- Ignoring outliers – Extreme values can provide key insights but may also distort the overall trend. Decide whether to highlight or remove them based on context.
- Forgetting context – Without a clear explanation of what’s being measured, even the best scatter plot can be misinterpreted.
Software for scatter plots
The scatter plot is one of the most widely used data visualizations. It can be created by almost every data visualization software package. The scatter plots in this post have all been created using Displayr.
You can make your own scatter plots in Displayr, or check out the rest of our Beginner’s Guides!