

Correlation is a term that is a measure of the strength of a linear relationship between two quantitative variables (e.g., height, weight). This post will define positive and negative correlations, illustrated with examples and explanations of how to measure correlation. Finally, some pitfalls regarding the use of correlation will be discussed.
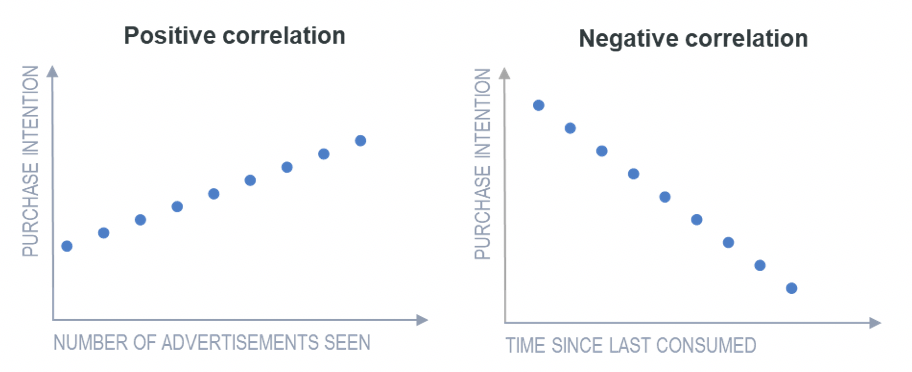
Positive correlation is a relationship between two variables in which both variables move in the same direction. This is when one variable increases while the other increases and vice versa. For example, positive correlation may be that the more you exercise, the more calories you will burn. Whilst negative correlation is a relationship where one variable increases as the other decreases, and vice versa.
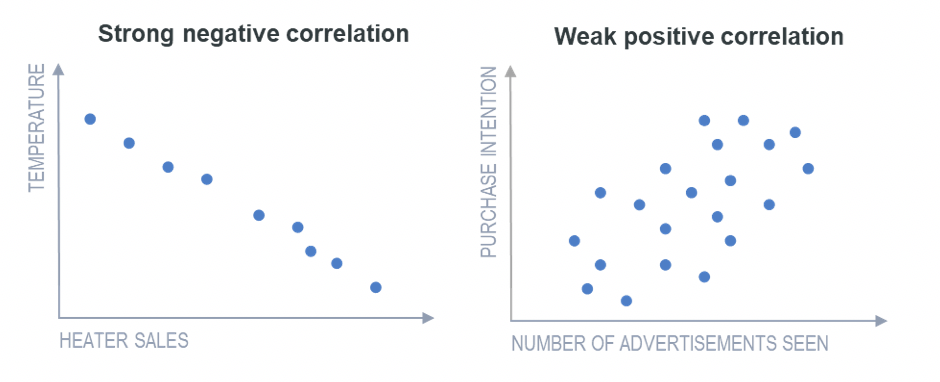
Where it is possible to predict, with a reasonably high level of accuracy, the values of one variable based on the values of the other, the relationship between the two variables is described as a strong correlation. A weak correlation is one where, on average, the values of one variable are related to the other, but there are many exceptions.
Pearson’s Product-Moment Correlation
The most common measure of correlation is Pearson’s product-moment correlation, which is commonly referred to simply as the correlation, the correlation coefficient, or just the letter r (always written in italics). The correlation coefficient r measures the strength and direction of a linear relationship, for instance:
- 1 indicates a perfect positive correlation.
- -1 indicates a perfect negative correlation.
- 0 indicates that there is no relationship between the different variables.
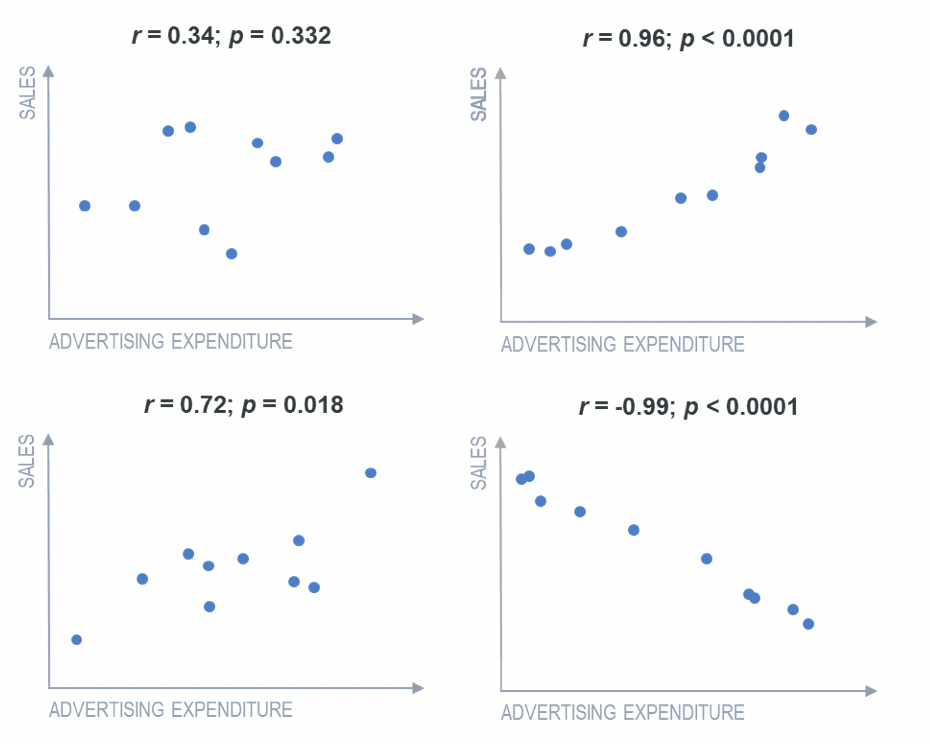
Values between -1 and 1 denote the strength of the correlation, as shown in the example below.
Create your own Correlation Matrix
Types of correlation tests
Besides Pearson’s correlation, there are several other ways to measure relationships between variables:
- Spearman’s Rank Correlation: Great for ordinal data or when your data isn’t normally distributed. It works by ranking the values rather than using the raw data.
- Kendall’s Tau: Another option for ranked or ordinal data, especially useful with small sample sizes or lots of tied ranks.
- Point-Biserial Correlation: Used when you want to measure the relationship between a continuous variable and a binary (yes/no) variable.
- Cramér’s V: Ideal for understanding the association between two categorical variables.
Misinterpreting correlations
Just about all the common problems that can render statistical analysis meaningless can occur with correlations.
One example of a common problem is that with small samples, correlations can be unreliable. The smaller the sample size, the more likely we are to observe a correlation that is further from 0, even if the true correlation (obtained if we had data for the entire population) was 0. The standard way of quantifying this is to use p-values. In academic research, a common rule of thumb is that when p is greater than 0.05, the correlation should not be trusted.
Another problem, illustrated in the top-left chart below, is that a single unusual observation (outlier) can make the computed correlation coefficient highly misleading. Correlations only show the extent to which one variable can be predicted by another. They do not pick up situations where the difference in the predictive values is too small to be considered useful. For instance, situations where the effect size may be too small, as shown in the top-right chart below.
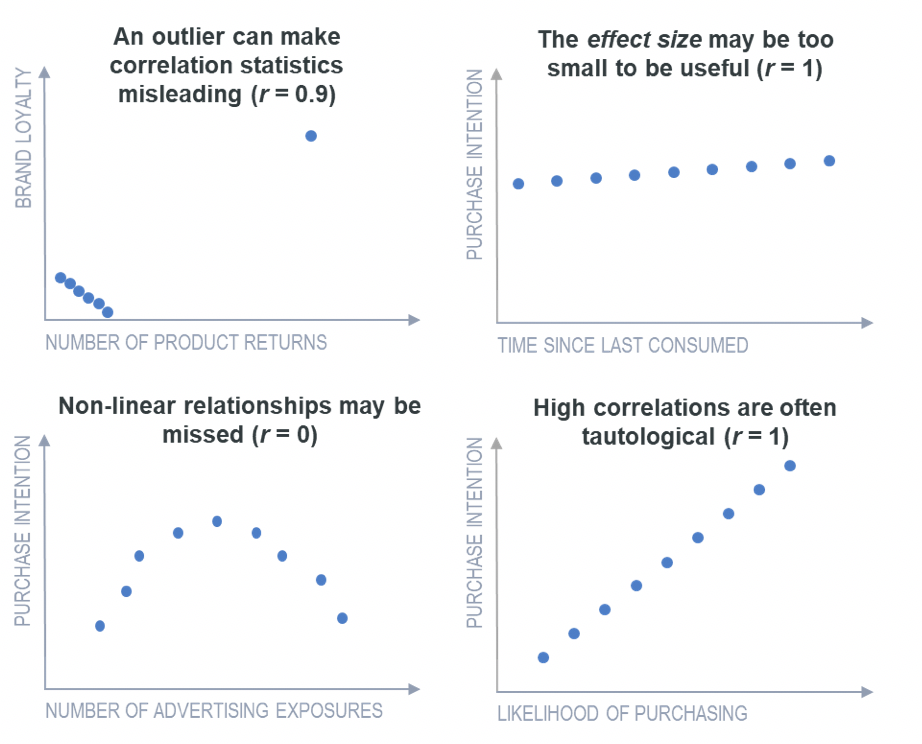
Another problem with correlation is that it summarizes a linear relationship. If the true relationship is nonlinear, then this may be missed. One more problem is that very high correlations often reflect tautologies rather than findings of interest.
Regression vs correlation: what’s the difference?
One of the golden rules when talking about correlation is to remember that correlation does not equal causation. Correlation measures the strength and direction of a linear relationship between two variables. This means it’s great for quickly identifying potential relationships in your data—like whether satisfaction scores rise alongside customer retention, or if ad recall increases with media spend.
What it doesn’t tell you is how one variable affects the other. Regression does. It quantifies how changes in one variable predict changes in another, giving you a mathematical formula for making predictions. This makes it useful when you’re trying to understand the drivers behind key outcomes—like how much an increase in brand awareness is likely to boost purchase intent, or how different ad features contribute to overall campaign effectiveness.
Want to learn more? Read our guide to regression analysis techniques.
