


Why functional data analysis?
In classical statistics, we work with measurements that consist of a single number, such as a person’s weight. Whereas in, multivariate statistics, we take multiple measurements for each subject/unit, e.g. height, weight, and age. In some applications, it is useful to consider more general objects as the unit of measurement under study. For example, treating blood vessels in a human body as tree-structured data or 3D brain images as a special mathematical manifold.
With advances in data collection methods, there are now several fields that generate samples at such a fine grid. It makes more sense to think of each sample as being observed on a continuum. The continuum is usually time; for example, the high frequency, tick by tick values of a stock market index. However, the continuum may not always be time; for example, we might have measurements of the coordinates in a plane of children’s gaits.
Examples of functional data analysis
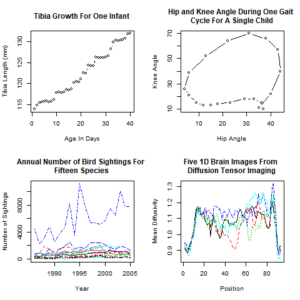
The following figure contains four examples of functional data analysis. The top two plots show only a single functional data observation from a sample. The first shows a growth curve for one infant during the first 40 days from birth. The second shows knee and hip angles for one boy during his gait cycle.
The bottom two plots show a collection of curves from two more datasets. The first are annual counts of the number of sightings for 15 different bird species at the Kodak National Wildlife Refuge in Alaska between 1986 to 2005. The final plot shows a summary measure called mean diffusivity that results from a brain imaging technique known as diffusion tensor imaging. The mean diffusivity at 93 positions in a particular tract in the brain is shown for five subjects.
More information about functional data analysis
An important assumption is that the underlying functions are smooth, i.e. generally well-behaved and not too wiggly. This type of data analysis is particularly useful when you wish to learn information about the rate of change (i.e. the derivatives) of the subject. A classic example from physics would be to study the speed and acceleration of an object given measurements of its position over time.
Whilst the underlying mathematical theory can be quite complicated, analyzing the data in practice is accomplished using simple extensions of popular tools from multivariate statistics. One frequently used approach is an extension of principal components analysis to functional data called FPCA.
Another popular use case is using the curves as inputs or outputs in a regression analysis. The functional linear model is both the simplest and the most popular. Perhaps the most promising application involves using functional data methods to analyze dynamical systems such as those arising in population dynamics.
Want to find out more about data analysis? Check out more topics on our Displayr blog.