


The R-squared statistic quantifies the predictive accuracy of a statistical model. It shows the proportion of variance in the outcome variable that is explained by the predictions. It is also known as the coefficient of determination, R², r², and r-square. This article will go over the key properties of R², how it is computed, and its limitations.
Key properties of R-squared
R-squared, otherwise known as R² typically has a value in the range of 0 through to 1. A value of 1 indicates that predictions are identical to the observed values. An R-squared value can not be greater than 1. A value of 0 indicates that there is no linear relationship between the observed and predicted values, whereas “linear” in this context means that it is still possible that there is a non-linear relationship between the observed and predicted values. Finally, a value of 0.5 means that half of the variance in the outcome variable is explained by the model. Sometimes the R² is presented as a percentage (e.g., 50%).
What does R-squared mean?
There are many equivalent ways of computing R². Perhaps the simplest is:
R² = Explained sum-of-squares / Total sum-of-squares
I’ve illustrated this in the table below. The first column, called Observed, shows the nine observed values (i.e., of the outcome variable). The second column contains the observed values minus their average value of 1.95. The third column squares these values. The sum of these squared values is called the Total sum-of-squares (TSS).
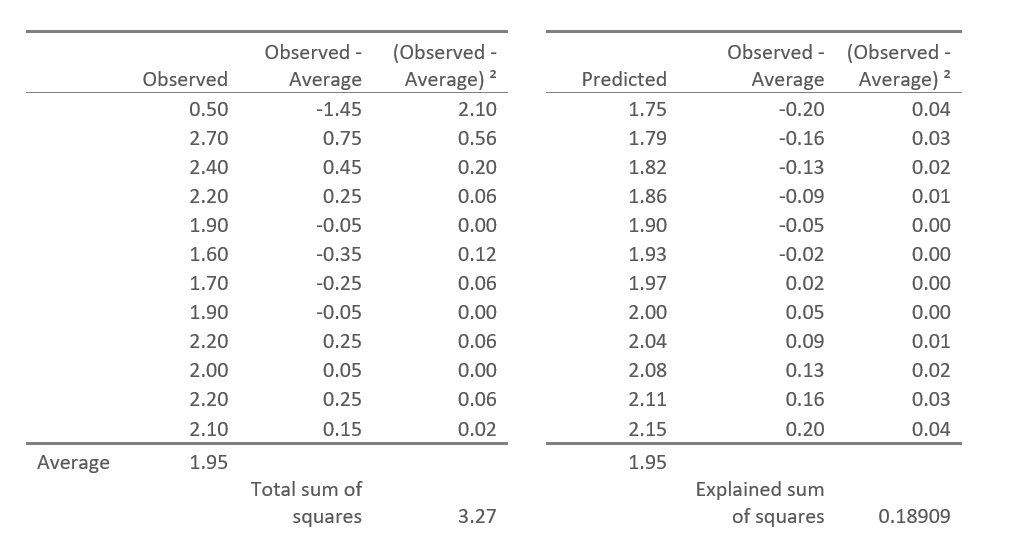
The fourth column shows the predicted values (in this case from a linear regression). The Explained-sum-of-squares are computed using the predicted values in the same way as was done with the observed values. The ratio of these numbers, 0.18909/3.27 = 0.05783 = R².
An alternative way of computing R² is as the square of Pearson’s product-moment correlation. In most conventional situations these two calculations will produce the same values. They can differ when the model being used is not sensible (e.g., a model where the predictions are less accurate than chance) or when being computed for data that has not been used when fitting the model.
How to use R2
R² has two main uses. One is to provide a basic summary of how well a model fits the data. If R² is only 0.1, then in an absolute sense, the R² is only explaining a tenth of what can be explained. Similarly, an R² of .99 is explaining almost all that can be explained.
The other main application of R² is to compare models. All else being equal, a model with a higher R² is a better model.
What does an R2 value close to 1 mean
An R² value close to 1 – in theory – indicates that the model explains nearly all of the variance in the dependent variable, suggesting a very good fit between the observed data and the predicted values. This means the independent variables in the model have a strong linear relationship with the outcome variable.
However, it’s important to remember that a high R² doesn’t guarantee that the model is accurate or appropriate—there may still be underlying issues with the data or model assumptions. In fact, in 25 years of building models, I have come to learn that values above 0.9 usually mean that something is wrong.
Linear regression and R-squared
R-squared is one of the key summary metrics produced by linear regression. It tells you how well the model explains the variation in the outcome variable. A value close to 1 means the regression model fits the data well; a value near 0 means it doesn’t. While R-squared provides a measure of fit, it doesn’t tell you whether the model is statistically significant or whether the predictors are meaningful—that’s where other regression diagnostics, like p-values and confidence intervals, come in.
Limitations of R-squared
A common misunderstanding of R² is that there is a threshold. For example, a model needs to have an R² of more than 0.9 to be good. This is rarely true: for example, a model that predicts that future share prices may be able to earn billions of dollars in profits for a hedge fund even if the R² is only 0.01.
R² can is also problematic when comparing models. In the case of regression, for example, if you add an extra predictor the R² will almost always increase. Therefore, while it is common for researchers to have a look at R² when comparing models, more sophisticated methods (e.g., statistical tests, information criteria) should be used most of the time.
Variants of R2
There are a number of variants of R². The most well-known is the Adjusted R² Statistic, which is designed to make it possible to compare R² across models with different numbers of predictors. Various pseudo-R² statistics have been developed for models for categorical outcome variables.
Make sure you check out our post on “8 tips for interpreting R-Squared“!
Find out more about regression analysis in Displayr.
