Don’t forget you can create free pictographs using Displayr’s pictograph maker.
Pictographs are often subject to ridicule. They are seen to compromise interpretability in favor of glitz. They are only “for kids”: an undeserved reputation which neglects situations where pictographs outperform bar charts. One such situation is for small count data.
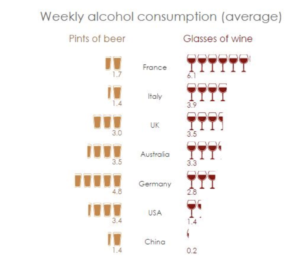
Look at the pictograph example above. Without looking at a legend or axis label, we instantly associate one beer glass icon with one glass of beer, and one wine glass icon with one glass of wine. It is easy to draw conclusions from this. The French and Italians prefer wine, while Germans love beer. The British and Australians drink roughly equal amounts of beer to wine, and the Americans and Chinese consume lower levels overall, preferring beer. When if comes to showing small count data, the pictograph chart is superior.
You can create your own pictograph, or modify the pictographs in this article.
The science of the pictographs
This example of a pictograph demonstrates that pictographs are particularly useful for displaying small count data. This is jargon for whole numbers that are greater than or equal to zero. Examples include number of meals in a day, how often a horse kicks you, and so on.
The direct correspondence between the symbols and data aids interpretation. It is precisely for this reason that pictographs are a staple in early childhood education. Nevertheless, pictographs have a poor reputation among data visualization purists. This in spite of a notable secondary benefit: pictographs are easy to remember.
Common sense suggests that there must be a maximum number of icons that can be shown before these benefits begin to degrade. While I am unaware of any scientific studies of this, the popular (yet unscientific) psychological “law” of seven plus or minus two suggests that we should strive to create pictographs where the key numbers are in the single digits.
You can create your own pictograph, or modify the pictographs in this article.