


The k-Means cluster analysis algorithm is a method for grouping similar cases into groups, or clusters. The final clusters will be different from each other, while the cases within a cluster are broadly similar to each other. In Displayr, we can run a k-Means Cluster Analysis by creating a k-Means object, selecting the clustering variables and the number of clusters.
Choose your clustering variables
To run the k-Means in Displayr, we first need to select the variables that we want use as inputs to the segmentation, what are commonly called the clustering variables. In the example below, we’ll use a behavioral and attitudinal statement battery on mobile technology. Questions were asked as a 5-point agree/disagree scale. We’ll use the top 2 box responses to each of the statements as the inputs to our k-Means cluster analysis.
You can use any other numeric variables as clustering variables that can potentially provide differentiation between the respondents and therefore help define the clusters.
Check out the interactive tutorial on running k-Means
Running the k-Means Cluster Analysis
To setup the cluster analysis in Displayr, select Insert > Group/Segment > K-Means Cluster Analysis. A cluster analysis object will added to the current page. The next step is to add the input variables to the cluster analysis. In this case, we’ll select the 11 behavioral/attitudinal statements from the Variables drop-down under in the Inputs section on the right. If the variables are grouped in a Variable Set, then the Variable Set may be selected instead, which is more convenient than selecting multiple variables.
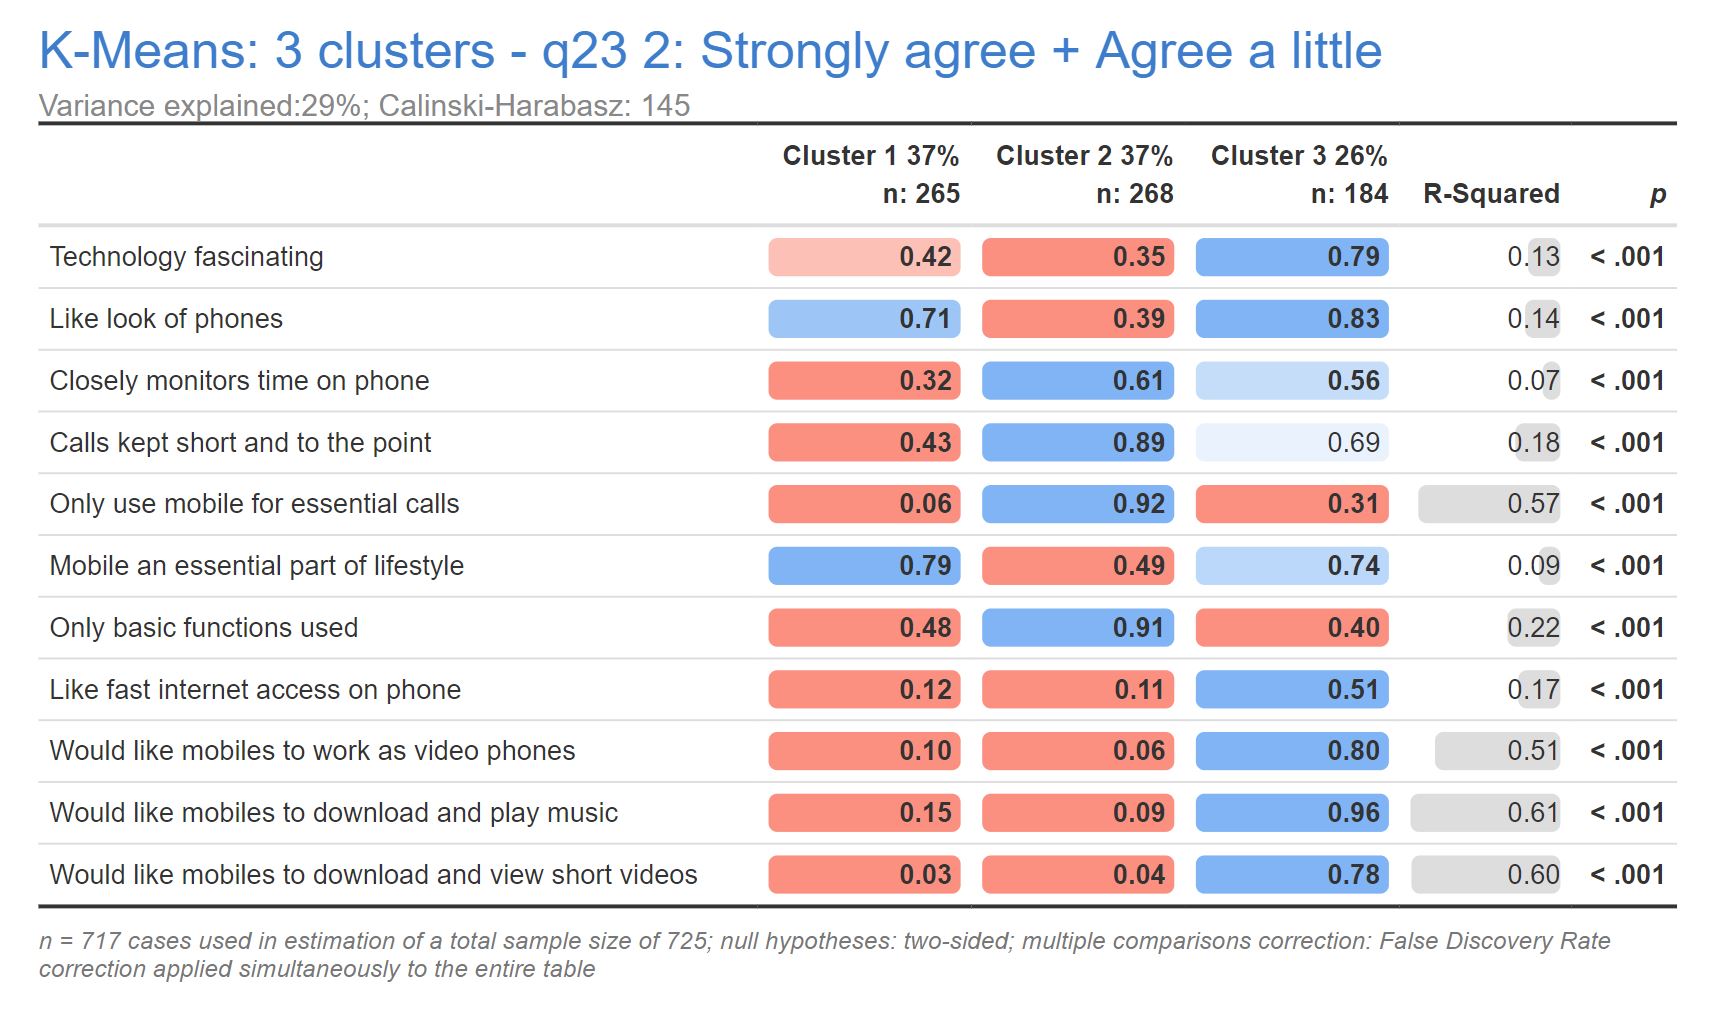
Next, we select the number of clusters that we want to create. I have opted to create 3 clusters, but you can choose anything you want here. For this example, we’ll leave the rest of the inputs with the default values selected. The following table of means output is generated.
Interpreting the Results
The standard table of means output shown above lists each of the clustering variables in the rows and shows the mean Top 2 Box percentage for each of the clusters.
- The size of each cluster (n) is shown in the column header.
- The red and blue highlights indicate whether or not the Top 2 Box score is higher (blue) or lower (red) than the overall mean. The red and blue colors are also scaled to provide some additional differentiation (darker shades of red/blue are farther from the mean).
- Means in bold font are significantly higher/lower than the mean score.
- The R-Squared value shows proportion of variance in the cluster assignment that is explained by the each of the clustering variables. In the example above, we can see that there are 4 statements that have a greater impact on the segment/cluster predictions than do the remaining variables.
- The p-value shows which statement variables are significant in the model.
Saving Cluster Membership
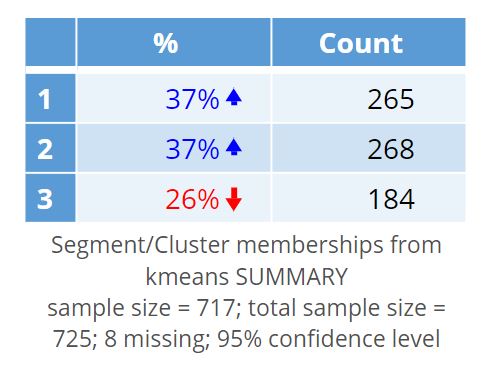
Individual respondents can be assigned to the individual clusters in Displayr by first selecting the k-Means Cluster Analysis output and then selecting Insert > Group/Segment > Save Variable(s) > Membership. A new categorical variable is added to the top of the data set called “Segment/Cluster memberships from kmeans”. Locate the new variable in the Data Sets tree and hover over it to preview the respondent level membership data or drag the variable onto the page to create a table.
This segment/cluster variable can be used for profiling against your demographic variables. Once you’ve identified the key differences between your clusters, try to come up with names that describe each cluster. You can add then these names to the cluster variable by first selecting the variable in the Data Sets tree, click the Labels button from the Properties on the right and enter your the cluster names in the Label column. Click OK to save the cluster names.