


For example, over the past 30 years the price of cinema tickets has increased and the number of people attending the cinema has also risen. However, it would be a mistake to conclude that if cinemas hike up their prices, attendance will also rise. Likewise, it would be wrong to assume that the rise in prices was directly caused by the increase in attendance rates.
Example of spurious correlation
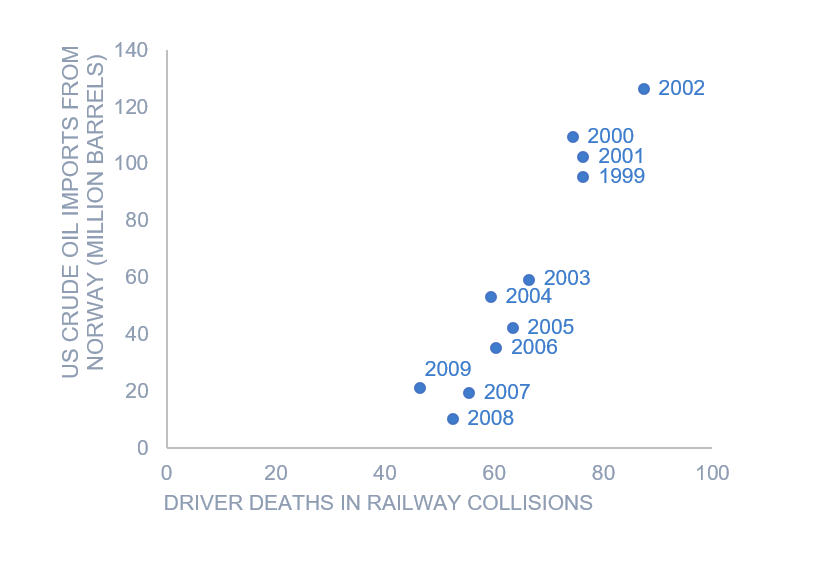
Each dot on the chart below shows the number of driver deaths in railway collisions by year (the horizontal position), and the annual imports of Norwegian crude oil by the US. There is a strong correlation evident in the data with a correlation statistic of 0.95. Yet this is a spurious correlation because there’s no reason to believe that railway deaths cause oil imports, or vice versa.
Causes of spurious correlation
One cause of spurious correlations is coincidence. If you look hard enough there are no shortages of coincidences in nature. The specific example shown above is from a website dedicated to finding and sharing humorous spurious correlations.
A more problematic type of spurious correlation is one where there is a causal but not direct relationship between the two variables. In the earlier example of cinema attendances and prices, prices go up due to inflation while attendance increases due to population growth and higher levels of disposable income – both occurring over time. Thus, a third variable, time, ’causes’ the correlation to appear.
Diagnosing spurious correlation
It is usually difficult to diagnose spurious correlation, since one person’s theory is another person’s conspiracy theory or coincidence. The most famous recent example of this was the debate over whether global warming is a consequence of human actions or not. In the 20th century, a similar debate occurred over whether tobacco use caused lung cancer.
The main tool in diagnosing whether a correlation is spurious or not is to examine the quality of the theory behind it. In the case of tobacco and lung cancer, only a clear explanation for the biological mechanism that caused smoking to lead to lung cancer settled the debate.
A more data-driven approach to diagnosing spurious correlation is to use statistical techniques to examine the residuals. If the residuals exhibit autocorrelation, this suggests that some key variable may be missing from the analysis.
Want to find out more? Check out our handy What is… guides!