


TL;DR: What is Cluster Analysis?
Cluster analysis groups similar objects into clusters based on shared characteristics. It’s especially useful for uncovering patterns in high-dimensional data that can’t be easily visualized.
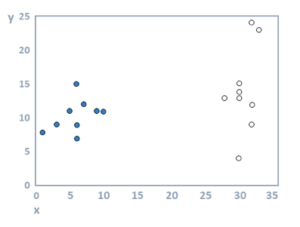
Cluster analysis refers to algorithms that group similar objects into groups called clusters. The endpoint of cluster analysis is a set of clusters, where each cluster is distinct from each other cluster, and the objects within each cluster are broadly similar to each other. For example, in the scatterplot below, two clusters are shown, one by filled circles and one by unfilled circles.
The required data for cluster analysis
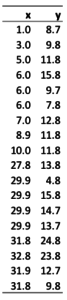
Typically, cluster analysis is performed on a table of raw data, where each row represents an object and the columns represent quantitative characteristic of the objects. These quantitative characteristics are called clustering variables. For example, in the table below there are 18 objects, and there are two clustering variables, x and y. Cluster analysis an also be performed using data in a distance matrix.
Why is cluster analysis used?
In the example above, it is easy to detect the existence of the clusters visually because the plot shows only two dimensions of data. Typically, cluster analysis is performed when the data is performed with high-dimensional data (e.g., 30 variables), where there is no good way to visualize all the data.
The outputs from k-means cluster analysis
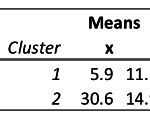
The main output from cluster analysis is a table showing the mean values of each cluster on the clustering variables. The table of means for the data examined in this article is shown below.
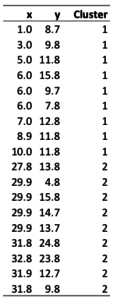
A second output shows which object has been classified into which cluster, as shown below. Other outputs include plots and diagnostics designed to assess how much variation exists within and between clusters.
Cluster analysis algorithms
Cluster analysis is a computationally hard problem. For most real-world problems, computers are not able to examine all the possible ways in which objects can be grouped into clusters. Thousands of algorithms have been developed that attempt to provide approximate solutions to the problem. The three main ones are:
- Hierarchical clustering: This technique starts by treating each object as a separate cluster. Then, it repeatedly executes the following two steps: (1) identify the two clusters that are closest together, and (2) merge the two most similar clusters. This continues until all the clusters are merged together.
Try your own Hierarchical Cluster Analysis
- k-means cluster analysis: This technique requires the user to specify a required number of clusters. Initially, observations are allocated to clusters using some arbitrary process (e.g., randomly). Then, the cluster means are computed, and objects are allocated to the closest cluster. These last two steps are repeated until the clusters do not change.
- Latent class analysis: In terms of process, this is like k-means, except that it can be used with both numeric and non-numeric data.