

TL;DR
Linear regression is a statistical technique used to model the relationship between one or more predictor variables and an outcome variable. This post covers some of the different types of linear regression with examples (using real-world sales and advertising data), explains how to interpret regression equations, and walks through how to check if your regression model is reliable.
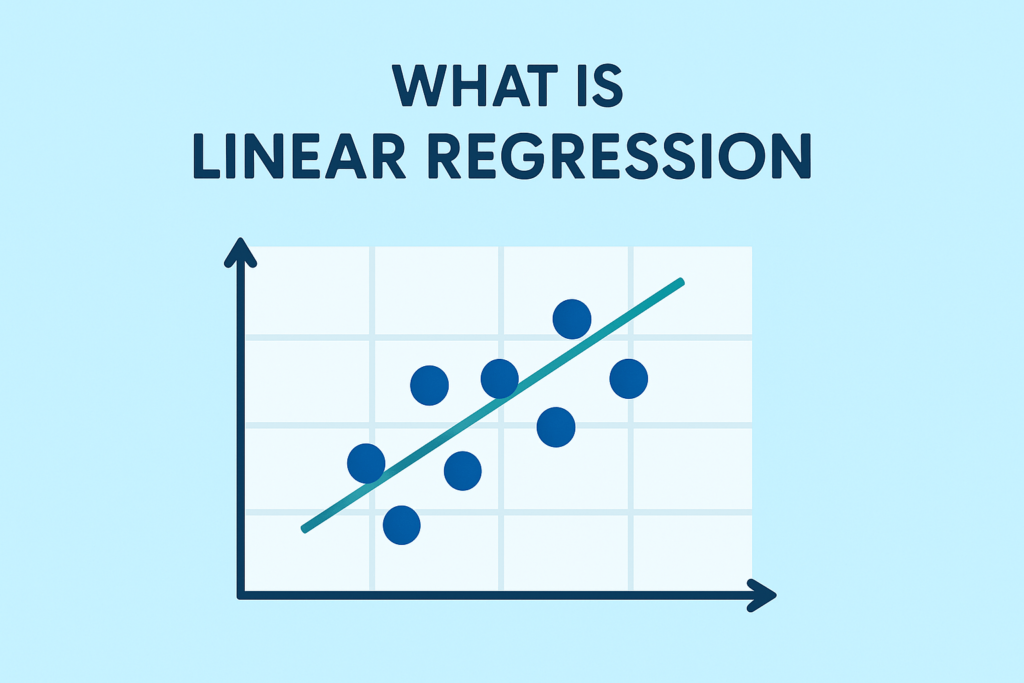
What is Linear Regression
Linear regression quantifies the relationship between one or more predictor variable(s) and one outcome variable. Linear regression is commonly used for predictive analysis and modeling. For example, it can be used to quantify the relative impacts of age, gender, and diet (the predictor variables) on height (the outcome variable). Linear regression is also known as multiple regression, multivariate regression, ordinary least squares (OLS), and regression. This post will show you examples of linear regression, including an example of simple linear regression and an example of multiple linear regression.
Create your own linear regression
Assumptions for Linear Regression
Although linear regression is an effective way to make predictions, there’s a number of conditions that need to be met in order for it to be successful.
-
The dependent variable should be continuous. Variables from Likert scales can be used if they have five or more response options.
-
Predictor variables can be either continuous or binary (dummy-coded). Categorical predictors are also acceptable—these are automatically converted into a set of binary variables for use in the regression.
-
A key requirement is that predictors have a linear relationship with the outcome variable.
-
Ideally, predictor variables follow a normal distribution, and any missing data should occur randomly rather than in a systematic pattern.
-
The model assumes equal variance of residuals across all levels of predicted values (homoscedasticity). If this condition is not met, it results in heteroskedasticity, which can bias the results.
-
Residuals should be independent of one another (no autocorrelation). This is particularly important in time-series data, such as stock prices, where consecutive values can influence each other.
-
In multiple regression, predictor variables should not be highly correlated with each other (no multicollinearity). When multicollinearity is present, it inflates standard errors, making it difficult to determine the true effect of each predictor.
Want to learn more about regression analysis techniques? Check out our how-to guide.
Simple Regression Example
The table below shows some data from the early days of the Italian clothing company Benetton. Each row in the table shows Benetton’s sales for a year and the amount spent on advertising that year. In this case, our outcome of interest is sales—it is what we want to predict. If we use advertising as the predictor variable, linear regression estimates that Sales = 168 + 23 Advertising. That is, if advertising expenditure is increased by one million Euro, then sales will be expected to increase by 23 million Euros, and if there was no advertising we would expect sales of 168 million Euros.

Multiple Linear Regression Example
Linear regression with a single predictor variable is known as simple regression. In real-world applications, there is typically more than one predictor variable. Such regressions are called multiple regression. For more information, check out this post on why you should not use multiple linear regression for Key Driver Analysis with example data for multiple linear regression examples.
Returning to the Benetton example, we can include year variable in the regression, which gives the result that Sales = 323 + 14 Advertising + 47 Year. The interpretation of this equation is that every extra million Euro of advertising expenditure will lead to an extra 14 million Euro of sales and that sales will grow due to non-advertising factors by 47 million Euro per year.
Create your own linear regression
Interpretation of Linear Regression Results
When there is a single independent variable, you can use a scatterplot to visualize the relationship. In these cases, the regression line drawn through the scatterplot helps illustrate how changes in the predictor correspond to changes in the outcome.
More broadly, interpreting linear regression results involves understanding what the coefficients (a parameter multiplied by a variable) tell us about the relationships between variables. Each coefficient represents the estimated change in the outcome variable for a one-unit change in the corresponding predictor, assuming all other variables are held constant.
When interpreting linear regression results, it’s important to remember that regression shows association, rather than causation.A significant coefficient means there’s a statistical relationship—not necessarily a causal one—unless the model is supported by experimental or quasi-experimental design.
Formula for Simple Linear Regression
The formula for simple linear regression (one independent variable) is:
Predicted Y = a + b * X1
The a and b coefficients must be estimated from the data; their meaning is:
- a is the intercept (or constant). It represents the predicted value for Y at X=0. In general, the constant is of little interest. For instance, if you’re estimating monthly rental price based on square footage, the predicted rent for zero square feet is unlikely to be of real interest—but it is still necessary for defining the regression line.
- b represents the expected change in Y per unit change in X.
- X is the independent (predictor) variable
Formula for Multiple Linear Regression
When the model includes more than one predictor variable, the formula becomes:
Predicted Y = a + b1 * X1 + b2 * X2 + … bn * Xn
b1 represents the expected change in the dependent variable when X1 increments by one, all other independent variables being equal. The same holds true for b2, b3, and so forth.
Checking the Quality of Regression Models
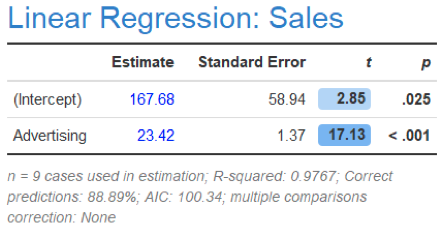
Estimating a regression is a relatively simple thing. The hard bit of using regression is avoiding using a regression that is wrong. Below are standard regression diagnostics for the earlier regression.
The column labelled Estimate shows the values used in the equations before. These estimates are also known as the coefficients and parameters. The Standard Error column quantifies the uncertainty of the estimates. The standard error for Advertising is relatively small compared to the Estimate, which tells us that the Estimate is quite precise, as is also indicated by the high t (which is Estimate / Standard), and the small p–value. Furthermore, the R-Squared statistic of 0.98 is very high, suggesting it is a good model.
A key assumption of linear regression is that all the relevant variables are included in the analysis. We can see the importance of this assumption by looking at what happens when Year is included. Not only has Advertising become much less important (with its coefficient reduced from 23 to 14), but the standard error has ballooned. The coefficient is no longer statistically significant (i.e., the p-value of 0.22 is above the standard cutoff of .05). This means is that although the estimate of the effect of advertising is 14, we cannot be confident that the true effect is not zero.
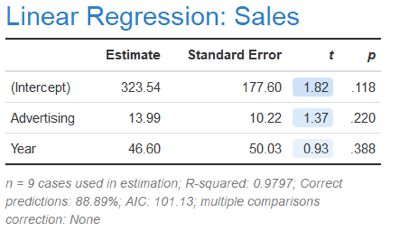
In addition to reviewing the statistics shown in the table above, there are a series of more technical diagnostics that need to be reviewed when checking regression models, including checking for outliers, variance inflation factors, heteroscedasticity, autocorrelation, and sometimes, the normality of residuals. These diagnostics also reveal an extremely high variance inflation factor (VIF) of 55 for each of Advertising and Year. Because these two variables are highly correlated, it is impossible to disentangle their relative effects i.e. they are confounded.
Create your own linear regression
Terminology
Predictor variables are also known as covariates, independent variables, regressors, factors, and features, among other things. The outcome variable is also known as the dependent variable and the response variable.
We hope this post has helped define linear regression for you!
To quickly create your own linear regression in Displayr, get started below.
Create your own linear regression