


When you run a customer feedback survey and ask a respondent to enter some text as an answer, it is very likely most respondents will answer the same things, but phrased (or spelled) differently. Questions like these are called Open-Ended Survey Questions.
The process of coding (a common term used to describe the process of categorizing text responses) aims to group these similar answers together so that the data can be analyzed using proportions and facilitate comparisons against other variables in your data. Answers are grouped by assigning one or more numbers to each answer (each number being referred to as a “code”), and each number has a corresponding label that encapsulates the sentiment expressed in the response.
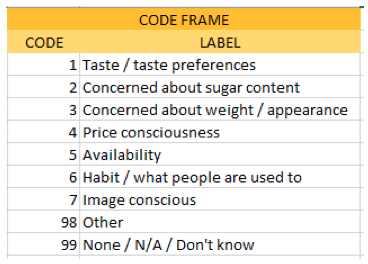
To do the coding you need to establish a code frame. This is the master list of code numbers with their corresponding code labels. Start by reading through some of the responses in your open text and write down the different concepts that are being mentioned. Assign a number to each. The most important thing to remember here is that you should code the meaning of the response in relation to the question. Simply coding up mentions of words ignores the meaning of the words in their context.
Always include two codes with high numbers, e.g. 98 and 99, where code 98 corresponds to “Other” and 99 “Nothing / N/A / Don’t know”. There will always be a handful of responses that won’t fit into any particular group that you’ve created, and there’s no point in creating a new code if only one or two people have given the response (unless you want very granular coding!). These rats-and-mice get coded to “Other”. From a quality perspective, no more than 10% of your responses should have a response coded into “Other”. Your preliminary code frame will look a bit like this:
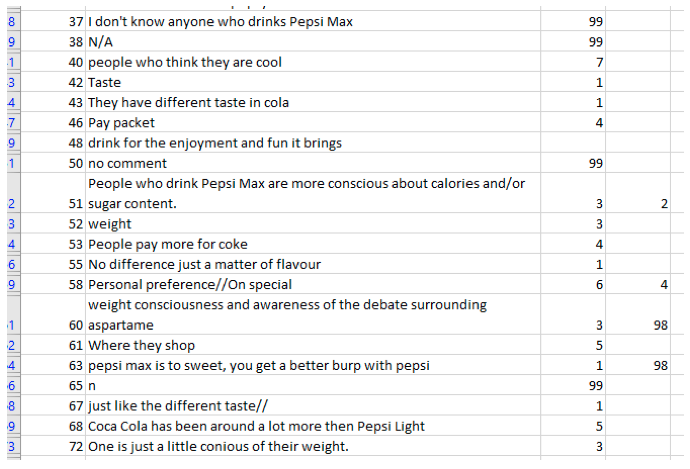
Once you’ve read through a chunk of the responses (there are no rules for how much to read through, but the first 1-200 responses should give a good idea) and you’ve created some of the more common codes, then start assigning code numbers to each response. If you’re working in a spreadsheet, then your coding work will start to look like the table below. Some software packages will provide an alternative interface for assigning codes, but the key principles are the same.
Learn how to analyze open-ended survey responses in Displayr
If a response contains a concept that you haven’t already included in your code frame, then add it to the code frame if you believe it will be mentioned several more times in your data. If not, then code it to 98 for now. When you’ve gone through all your coding once, filter the text responses on code 98 and review all the responses you’ve coded to “Other”. Add new codes to your code frame if necessary.
Ready to analyze your text?
Start a free trial of Displayr.
A good code frame shouldn’t have too many codes in it – this will make it unwieldy and difficult to use. It will, of course, depend on the quantity of data you have to code, the variability of responses, and the desired granularity. Once you get over 30 or 40 codes, however, coding can slow down significantly as you won’t easily keep all the codes in memory, instead of having to look them up in your code frame.
How AI Text Analysis Categorizes Open-Ended Responses
Displayr’s AI text analysis turns unstructured open-ended responses into coded, quantifiable themes in four steps — create, classify, optimize, and analyze.
- Create your themes. What used to mean manually reading every response to spot patterns now takes seconds. The AI suggests an initial set of themes — around 10 is a good starting point — which you then adjust to fit your project.
- Classify the responses. Using machine learning and natural language processing, the AI reads each response, interprets its meaning and context, and assigns it to your themes. It won’t be flawless, so review each theme and correct anything miscategorized.
- Optimize the coding frame. Merge or delete redundant themes: Delete removes a theme and its responses, while Delete and Reclassify as moves those responses to an existing theme. Where similar answers aren’t yet grouped, add new themes — many projects grow from 10 to 15 or more. This is where your judgment guides the AI’s speed.
- Analyze the results. Categorizing open-ended responses assigns each a numeric value, so you can run standard quantitative analysis — crosstabs, trends, and visualizations. You’ll also quickly spot which results aren’t worth pursuing, saving time before the next study.
Try AI Text Analysis
The process outlined above is a tried and true method for analyzing open-ended survey responses. However, it can be time-consuming. Advances in AI over the past few years have meant this entire process can now be mostly automated. In a few seconds, AI can read the survey responses, automatically create codes that match the text and categorize each answer.
Displayr’s #1 AI text analytics solution makes text categorization simple and empowers users to deliver deeper insights with visualizations, trend analysis, crosstabs, advanced analysis and more.
