

A repeated icon pictograph visually represents a number using multiple icons. It has similar options to the single icon pictograph, but is more suitable for count or integer inputs and gives more control over the layout of the icons.
Don’t forget you can create a pictograph for free using Displayr’s pictograph maker.
Click here for an interactive tutorial on creating pictographs
Input data for Repeated Icon Pictographs
You can create this visualization by selecting Insert > Visualization > Pictograph > Repeated Icon. Similar to the single icon pictograph, the data source of the input value can be either a typed numeric value, or an existing R output that computes a numeric value. However, the parameters that control how the input value are used are different. The scale is by default set to 1, which implies that 1 icon corresponds to a unit value of 1. This scale is intuitive to interpret. However, for certain data types, we may want different scales. For instance, in the example above we set the scale to 1000 because the number of cars is so large. Percentages or rates are also often shown as a number out of 100 (scale = 0.01) or 10 (scale = 0.1). Note that if the scale is too small, the pictograph may take a long time to render.
Customizing the icon layout
The default icon layout settings can handle dynamic data with a changing number of icons. The icons automatically resize (autosize) and are arranged to maximally fill the visualization object. That is, the layout is constrained by the width-to-height ratio of the visualization object. Alternatively, it is sometimes useful to set this to a fixed ratio. For example, in the pictograph below, we have set the width-to-height ratio to 1 to form a square. (The chicken icon is slightly longer in width than height, so 900 icons do not make a perfect square).
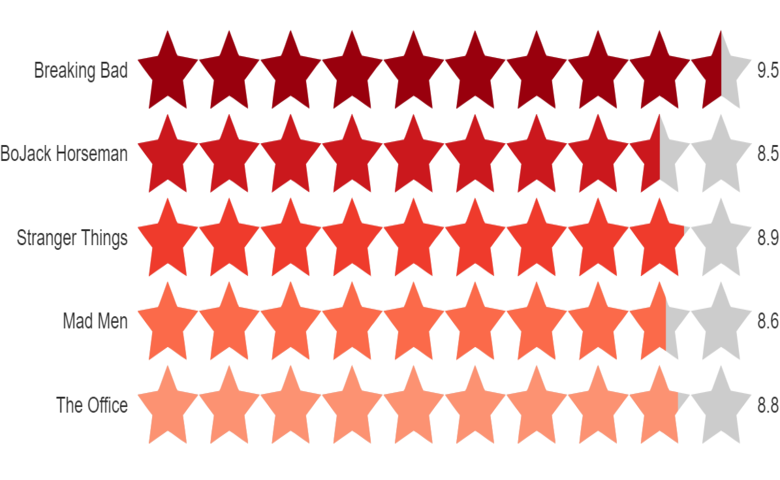
If you know the number of total icons, then the layout can be specified more concretely. For example, the pictograph below has the layout fixed to have all icons in one row. We have fixed the number of total icons at 5. The input value, which controls the number of filled (yellow) stars, can change over time.
If you are creating a page with multiple repeated icon pictographs, it is sometimes preferable to turn off autosize and set the icon width to a fixed size. You can also adjust the spacing between the icons by increasing the row and column padding.
Customizing the icon
Apart from the built-in icons, you can use your own icons in the pictograph. In the Format tab, go to the Icon dropdown and select (Custom icon). In the text box labeled Icon URL, you can then enter the URL of the image file you want to use as your icon. This should ideally be JPEG or PNG file (SVG files may not always work). If your image is not hosted on a web server, you can also use public Dropbox links.
Unlike the built-in icons, you will not be able to recolor the custom icons. You will need to use images with different colors for the filled and base icons. The images should be the same size, but they may differ in more than color. For example, you can overlay a female stick-figure on top of a male stick-figure. If no base icon URL is provided, the unfilled icons will be hidden.
Click here for an interactive tutorial on creating pictographs