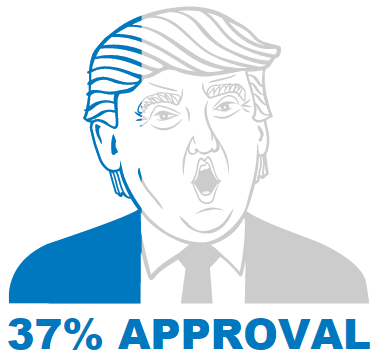

It is often useful to visualize or highlight a single number for infographics, dashboards or reports. One way to visualize a percentage or proportion is to use a single icon pictograph. For counts or volume data you may want to try a repeated icon pictograph instead.
Don't forget you can create an impressive pictograph for free using Displayr's free pictograph maker.
Creating a Single icon Pictograph
This visualization inserted from Insert > Visualization > Pictograph > Single icon. To enter data, you can choose from two types of data sources.
- Type or paste value. This option is the simplest way to enter data. It is useful for showing a fixed number or testing. For instance, in the example above we simply typed '0.6' as the input value. Instead of using decimals, you can also specify proportions as a fraction of a fixed denominator. For example, an input value of 1 with a maximum value of 2, will result in half the icon being filled.
- Use an existing R output. The second (default) option is more flexible. The R output can contain code which performs calculations using data sets in the Displayr document. Alternatively, it could contain code that reads data from the internet and automatically updates.
Customizing data labels
Controls for customizing the data labels can be found in the Format tab of the object inspector. You can choose whether or not to show data labels; or to position the labels above or below the icon. Note that the icon always sits in the center of the window, while the data label sits at the edge of the window. This means that resizing the window will adjust the spacing between the icon and the data label.
You can also control the formatting of the data label. In the example at the top of this article we set the Number type to Percentage to show 0.6 as 60%. You can also add prefixes or suffixes to include extra information into the pictograph
Customizing the icon
You can use also your own icons in the pictograph. In the Format tab, go to the Icon dropdown and select (Custom icon). In the text box labeled Icon URL, you can then put a URL to the image file you want to use as your icon. This should ideally be JPEG or PNG file (SVG files may not always work). If your image is not hosted on a web server, you can use public Dropbox links.
Unlike the built-in icons, you will not be able to recolor the custom icons. You will need to use images with different colors for the filled and base icons. The images should be the same size, but they can differ in more than color. For example, you can overlay a female stick-figure on top of a male stick-figure. If no base icon URL is provided, the unfilled icons will be hidden.
For both built-in and custom icons you can choose the direction of fill. In the example above, this was set to 'Radial' which is useful for circular icons. But for rectangular icons, it will be more appropriate to fill from 'top', 'bottom', 'left' or 'right'.

Get started making your own pictographs in Displayr, or find out more ways to visualize a single number!


