Step 1: Set up and estimate the choice model treating all the variables as categorical
Start by setting up the choice model keeping all the attributes as being categorical (see here for more info).
Step 2: Duplicate the model
In the Pages tree, click on the page that contains the choice model that was estimated in Step 1, and press Home > Duplicate. You do not need to wait for the calculations of this duplicated model to complete before proceeding to step 3.
Step 3: Set the values of the numeric attribute(s)
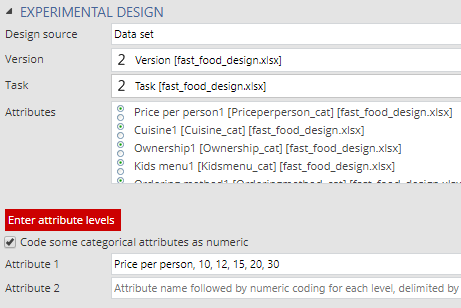
Select EXPERIMENTAL DESIGN > Code some categorical attributes as numeric (see below). Enter the names of any attributes, followed by commas, and the values that you want to use when treating the variables as numeric. When entering the numeric values, take care to enter them in the same order as they appear in the model estimate in Step 1. (If the model in Step 1 is still estimating, you can change MODEL > ITERATIONS to a small number (e.g., 6), so that it computes faster, but make sure you reset it back to 100 after doing this.)
Step 4: Remember when interpreting the data that the numeric variable will be on a different scale
The output below shows the estimated distribution of a numeric attribute relating to price of home delivered food. It would be very easy to look at this and conclude that, relative to Cuisine, Price per person is both not very important and that there is very little variation in terms of its importance in the population. However, this is not the right way to read this output.
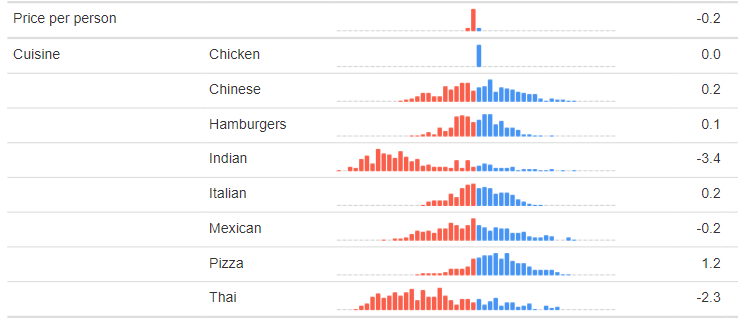
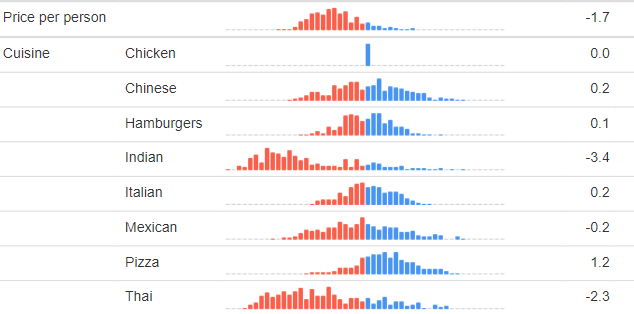
To illustrate this point, I’ve re-estimated this model, but rather than use prices of 10, 12, 15, 20, and 30, I’ve divided them by 10 and used prices of 1, 1.2, 1.5, 2. and 3. You can see this in the outputs below. Price appears to be much more important below, but in reality it is equally important in both models. Keep in mind that the values shown for Cuisine are utilities, whereas the distribution shown for Price per person is instead a coefficient.
For categorical data the ideas of a utility and a coefficient are interchangeable, but with numeric attributes they are not. In order to compute utility, we need to multiply the coefficient of the numeric attribute by the values. In the output above, it shows that the coefficient for Price per person is 0.2; this is rounded, and with an extra decimal the value is -0.17. The utility for $10 is then 10*-.17 = -1.7 and the utility for $30 is 30*-.17 = -5.1.
The easiest way to avoid any possibility of misunderstanding is to use Insert > Conjoint/Choice Modeling > Utilities Plot, which automatically computes the utility for the highest and lowest prices in the study.
To find out more about Conjoint Analysis in Displayr, head here!