
Filters.
Data filtering is the process of choosing a smaller part of your dataset and using that subset for viewng or analysis. It is usually temporary.
Continue reading

This blog post will take you through the automated tools for filtering and rebasing when analyzing survey data. We have already covered how to create…
Continue reading

In Displayr you can manipulate rows and columns directly in any Visualization or Paste/Enter Table output created via the Insert menu. This allows you to…
Continue reading

Introduction What is Data Filtering? What is Rebasing? 5 Things to Consider Before Building Your Dashboard Variables and Questions 5 Ways to Create a Filter in Displayr…
Continue reading
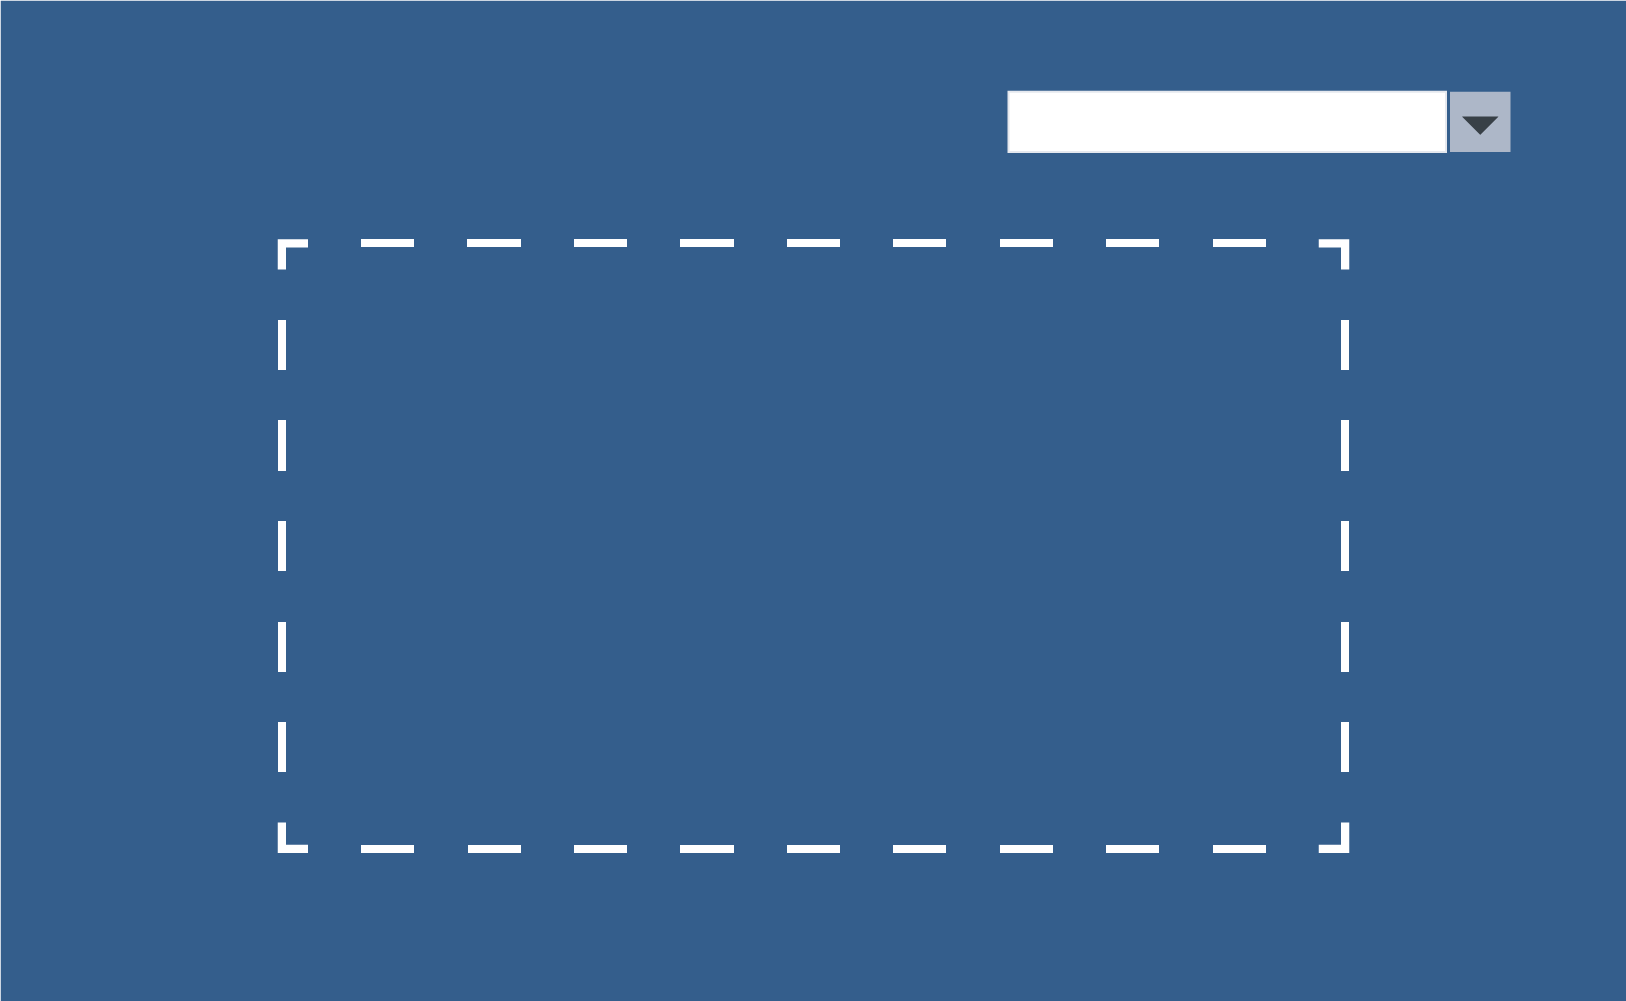
Example In the example below, the combo box says Hide Comments. If you click on it and change it to Show Comments a comment appears. How it works…
Continue reading

Use Displayr to save yourself time and work by automatically generating and exporting multiple, filtered reports.
Continue reading

Control boxes are a popular way for users to change things on a Displayr page. Here's how to use a control box to dynamically apply weights and filters.
Continue reading

With Displayr, you can show different patterns in your data by applying filters to analyses. One way to do this is by creating filters that…
Continue reading
This post describes how to set up documents to permit Displayr users to filter pages in an online document (i.e., dashboard). The user experience When…
Continue reading
When you are working in Displayr’s edit mode, you can choose which items on a page to filter by selecting the items and applying a filter. When…
Continue reading
A combo box can be added to a Displayr document by selecting Insert > Control (More), which causes a combo box to appear in the middle of the…
Continue reading

This blog shows how to create a filter. Before reading this blog, make sure you check out Using Displayr to filter data, analyses, and whole…
Continue reading
Displayr’s approach to filtering is uniquely powerful. Filters can be applied to tables, charts, complex visualizations, advanced analyses, and text (with a bit of care).…
Continue reading