

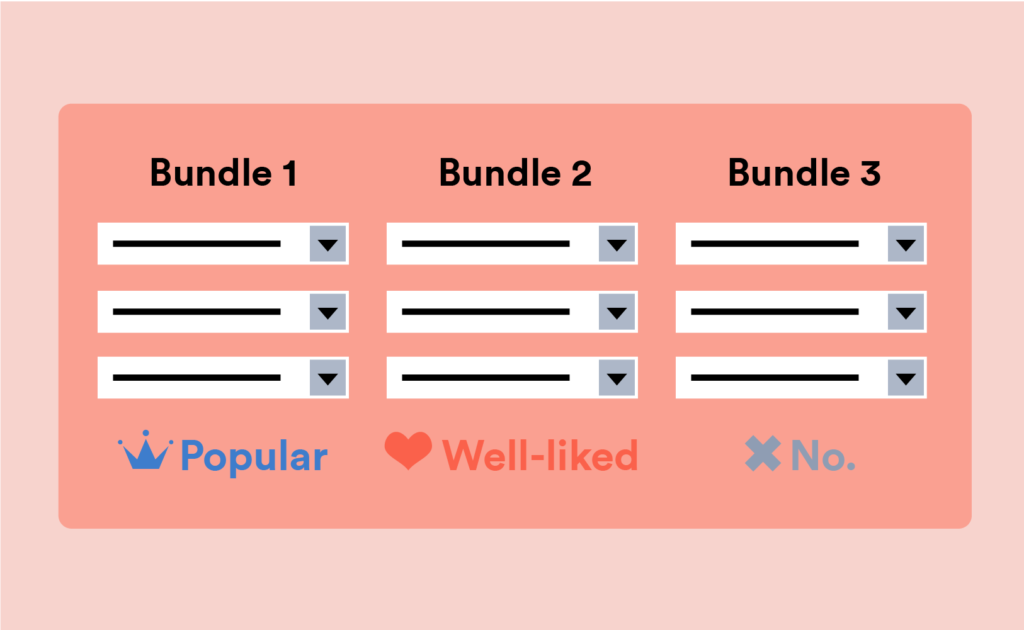
This one is a bit more complicated than the first five techniques we’ve talked about, but the idea of this technique is to find people’s preferences by providing them tradeoffs between a series of products and describing them based on certain attributes.
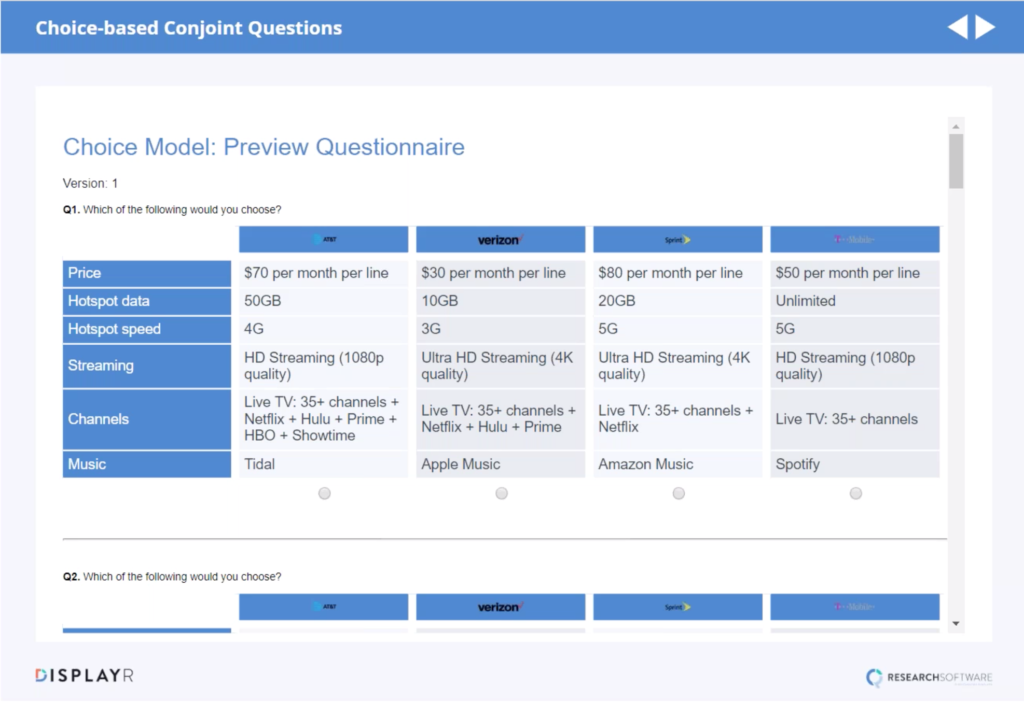
For example, below is a question that compares several different cell phone providers with different prices and features. They are asked to pick a provider based on the offered package’s prices and features. Then they are asked another similar question, but with different prices and features. The magic that comes out of this approach is that once these questions are answered we can estimate, with some complicated maths, what each person’s stated willingness-to-pay is for individual product features.
When working in pricing research, one of the key outputs from a conjoint approach is the Median Willingness-to-Pay Attribute Level. In the example below, we have a sample data of product features from the U.S. cellphone market. To start this approach, we have to set a baseline and within each attribute, the lowest level of performance is assigned a willingness-to-pay of $0, so everything else is relative to that number. So, we can see that 50% of people would be willing to pay $2.19 or more for an increase in hotspot data from 10GB to 20GB, and 50% of people would pay $9.71 or more for unlimited hotspot data relative to 10GB. But beware.
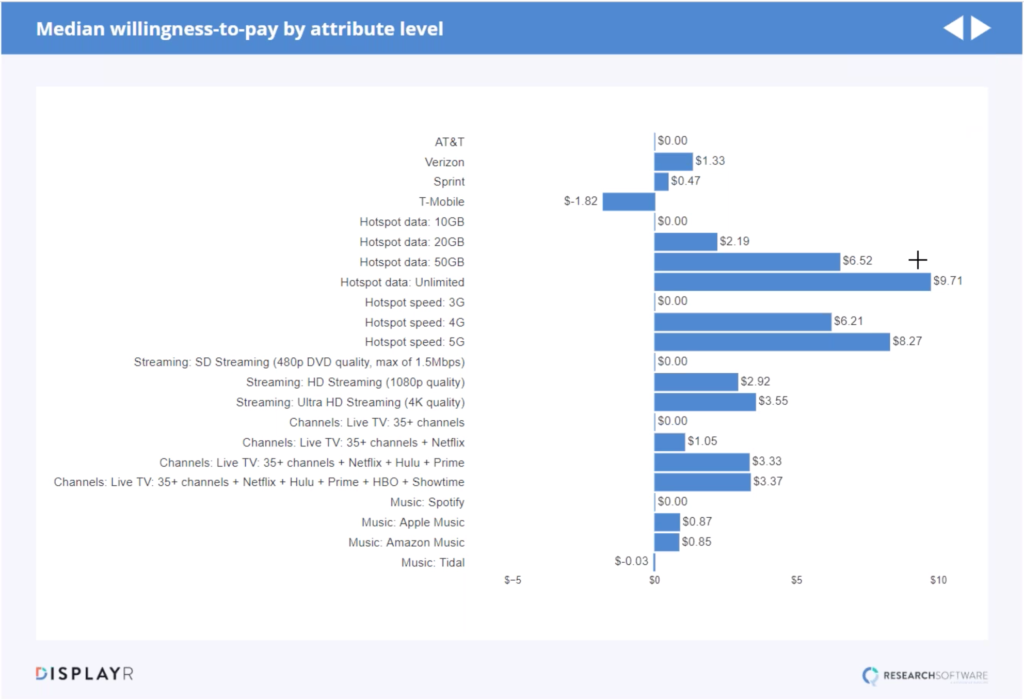
While this analysis says that 50% of people would be willing to pay an extra $9.71 to get an upgrade from 10GB to Unlimited Hotspot Data, they will only pay this if there is no competition. Because if a competitor is giving unlimited hotspot data for a much lower rate then that’s what the market will bear, and you won’t be able to charge the maximum willingness-to-pay.
The next key output that people love to get form conjoint studies is Simulator, which predicts preference share. Or, if you spend a lot of time calibrating it can sometimes be used to predict market share. Looking at the example simulator below, you can see that AT&T has a market share of 51%. But what happens when we increase their price from $30 to $40? The preference share will then drop to about 37%. So, from that, we can then construct a demand curve to work out the profit-maximizing price, the same way we have in the previous techniques.
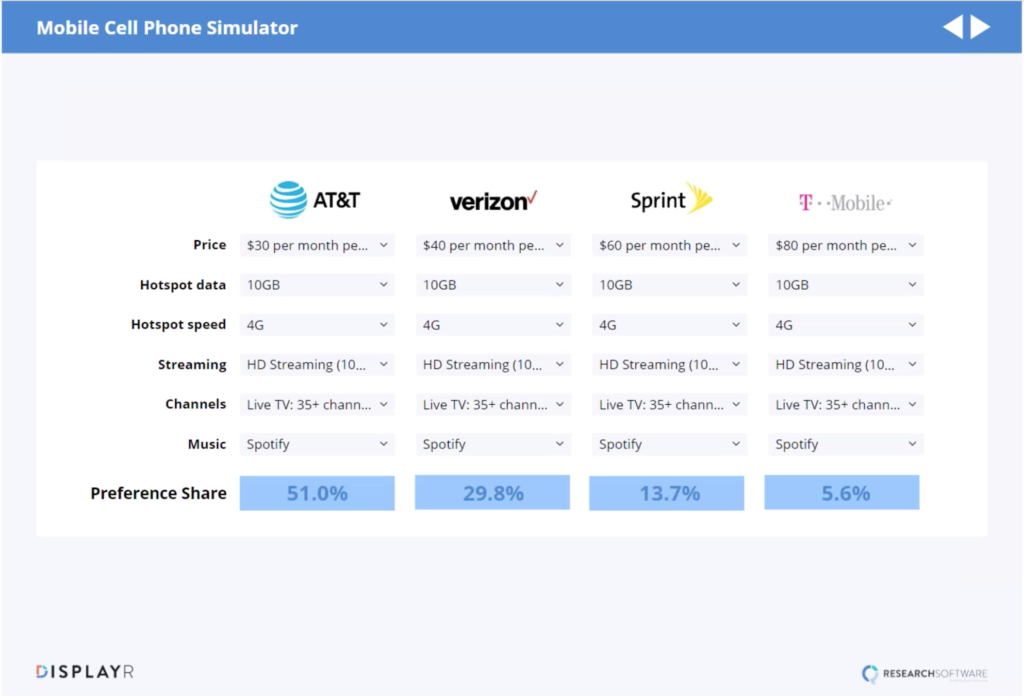
However, in practice, these optimizations are not always as useful as people envision. That’s because people will typically assume that the models are complete accurate predictors of market share and that’s rarely the case because so many key factors are ignored.
But in my history of consulting work, I have found the concept of Value Equivalence Line (VEL) to be much more useful. The idea of VEL is that a company should have a portfolio of products at different price points that match different benefits. With our cellphone company example, the idea is that the price points of the various phone plans should match the value of benefits included. So, the plans with successively higher price points will deliver more benefits.
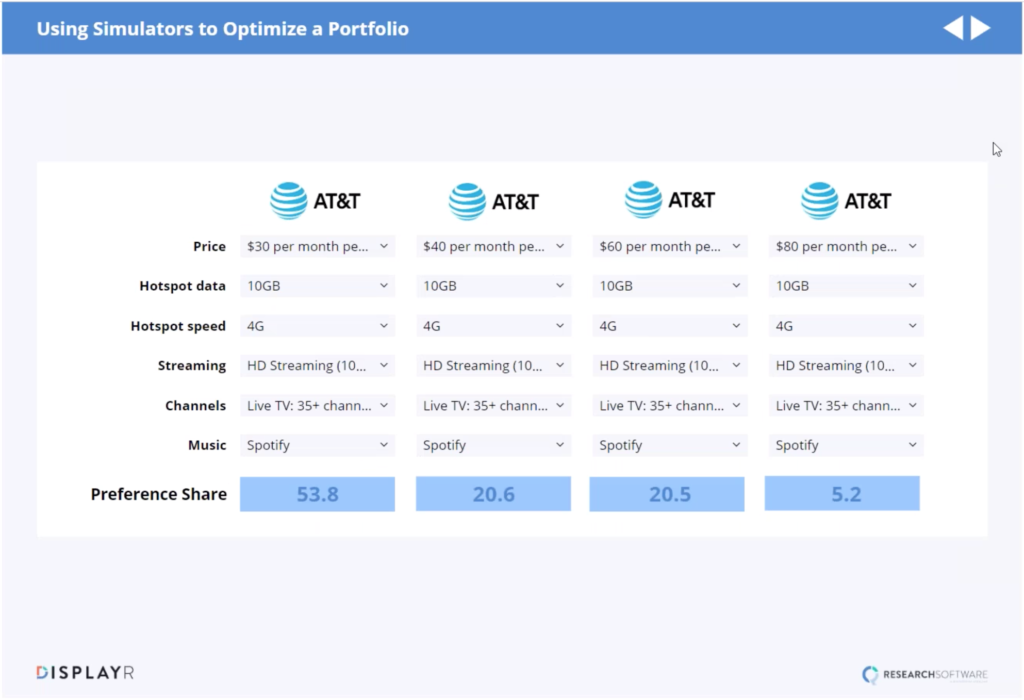
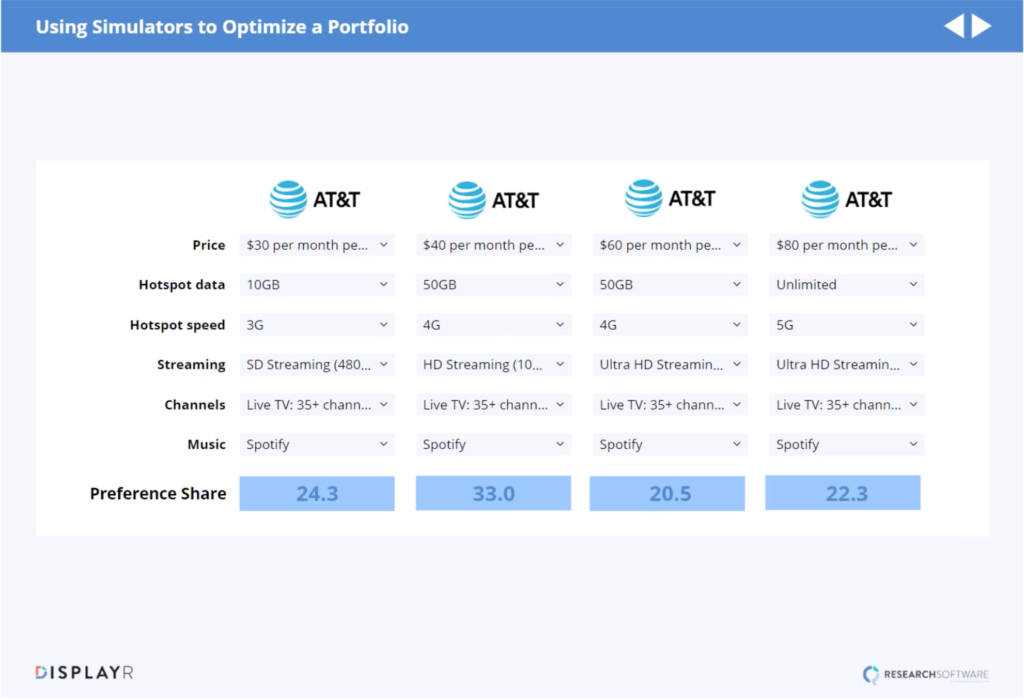
We can do the VEL approach with Simulator to find the right price for each cellphone plan. In the simulator example below, we just have AT&T and four different price points but everything else is the same. The model suggests that the majority of people will prefer the cheapest option, as one would expect. But when trying to optimize a portfolio, our goal is to come up with four products that have similar preference shares. So, in order to find a similar percentage of preference shares, you will start to edit the options outside of price so that they are broadly similar in preference share and roughly equal in value, which is shown in the second image below.
And while the first five approaches are still important in pricing research, I find that this approach is the most useful because you are looking at the many different factors that affect price in relation to preference share.
For more examples on the other pricing research techniques see: Price Salience, Price Knowledge/Awareness, Stated Willingness-To-Pay, Price Sensitivity Meter, Random Assignment.