An alternative approach (from Stated Willingness-to-Pay) for asking people what they will pay for something is known as the Price Sensitivity Meter.
This approach asks people four questions to determine their price preferences. The four questions are:
- At what price would you consider the product to be so expensive that you would not consider buying it? [too expensive]
- At what price would you consider the product to be priced so low that you would feel the quality couldn’t be very good? [too cheap]
- At what price would you consider the product to be a bargain—a great buy for the money? [cheap]
- At what price would you consider the product starting to get expensive, so that it is not out of the question, but you would have to give some thought to buying it? [expensive]
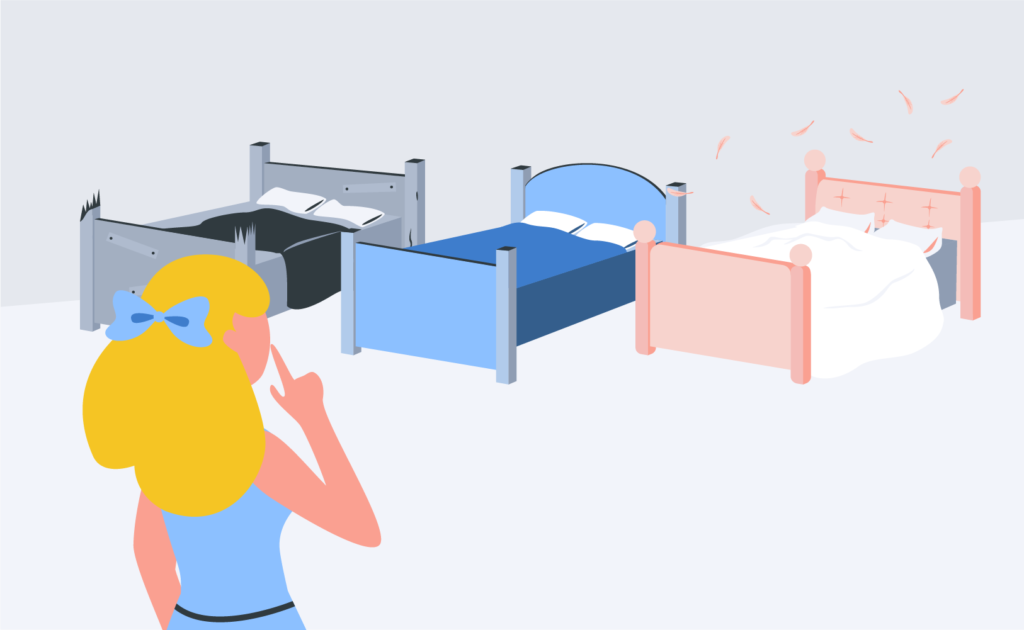
These questions are designed to work out the fairest price. A goldilocks price if you will, not too expensive but not too cheap—just right.
You can figure out the right price by using this approach in both Displayr and Q which have built-in tools that quickly compute the price sensitivity meter. For example, we’ll use the same iLock data we used in our third approach, Stated Willingness-to-Pay.
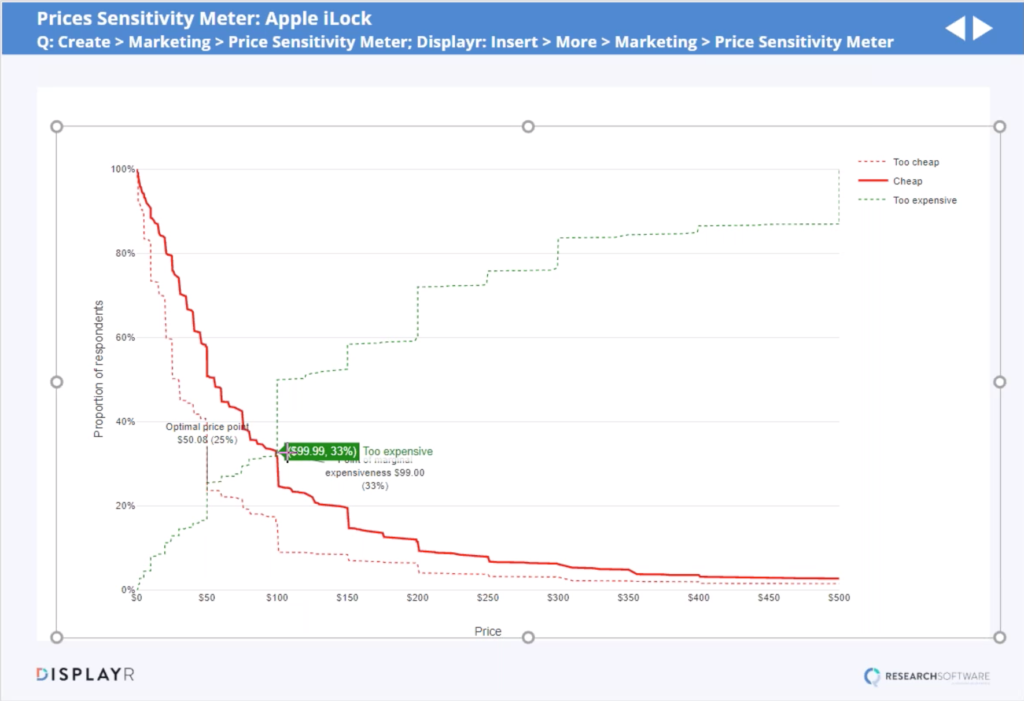
We’ll start with the first question by looking at the too expensive data. As you can see in the chart below, the thin dotted green line shows what percentage of people say is the highest price that they would pay for the iLock.
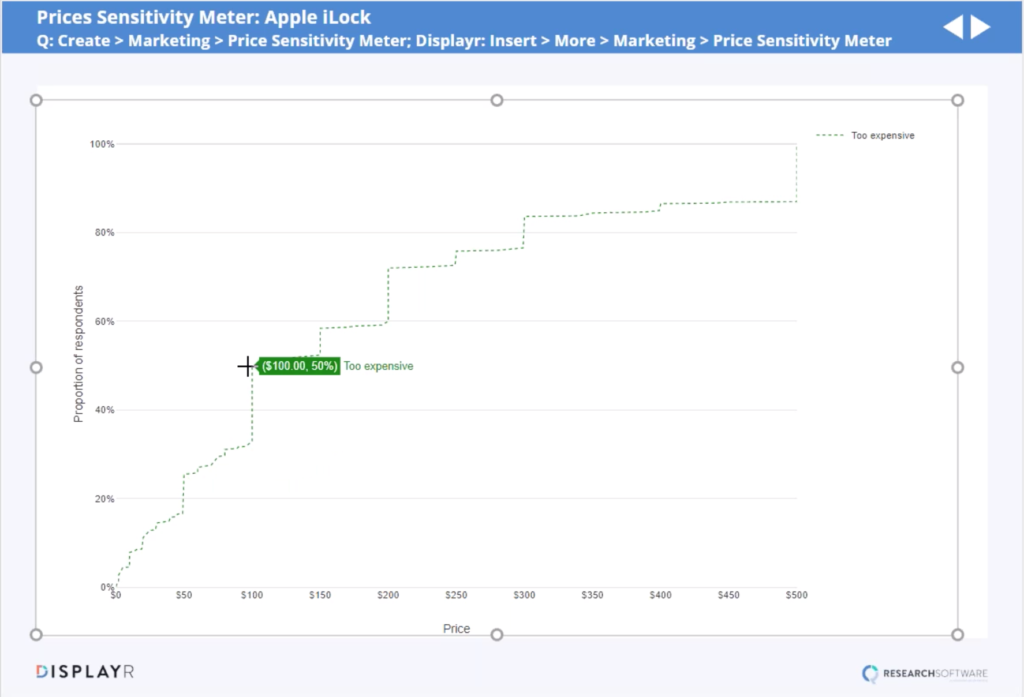
For example, if you look at the $50 mark you will see that about only 25% of people say that price is too expensive. So, if we sold the iLock at $50, then we can expect about 75% of the market to buy it.
But when you jump up to $100, that percentage climbs up to 50% of people saying that that price would be too expensive, and at $400, about 87% of people say that’s too expensive.
Now for comparison, we’ll overlay the too expensive information with the too cheap price data. In the image below, the dotted red line shows the prices and percentage of people’s preference of price that they find would be too cheap—a price at which they would doubt the quality of the product.
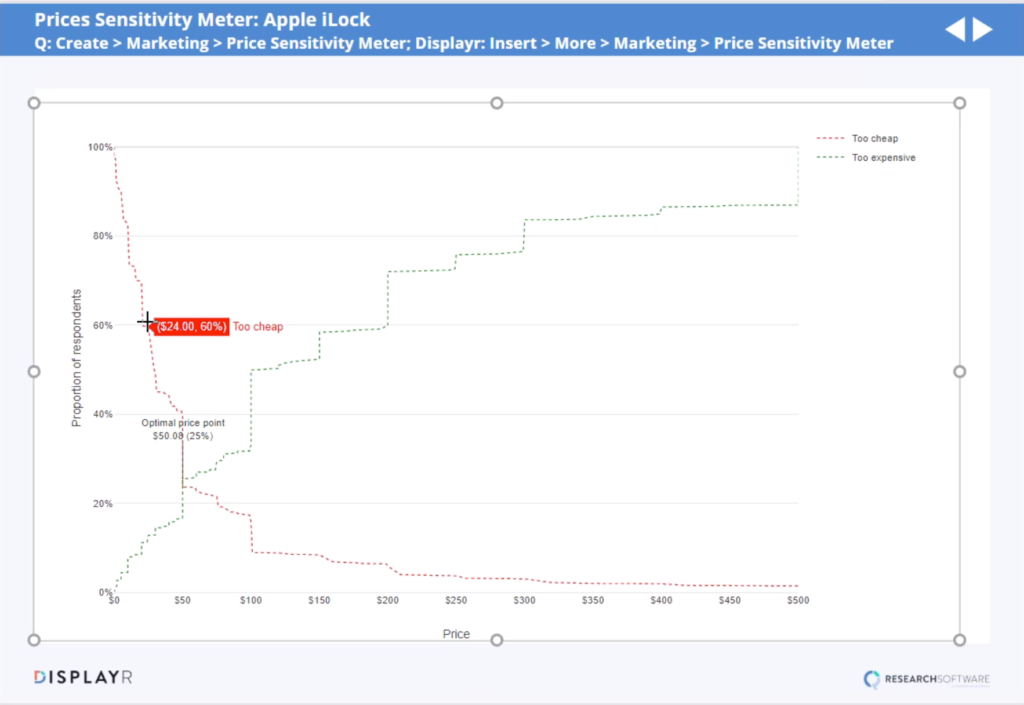
As you can see at the $24 mark, about 60% of people think that price would be too cheap for the iLock. However, the price at which these two lines intersect, which is at $50.08, about 25% of the market believes that price is either too expensive or too cheap. But, if we flip those numbers around, this would be the just right price for about 75% of the market.
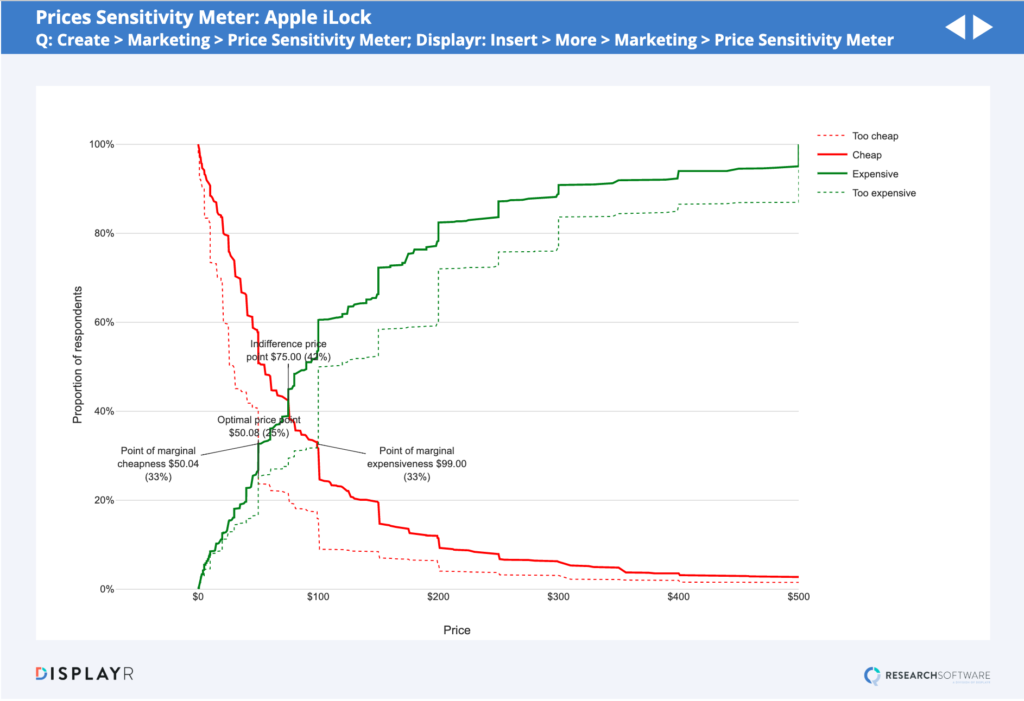
Now let’s continue and overlay the information a little bit more with the last two questions that are asked for the Price Sensitivity Meter. The first question asks what price people consider to be a bargain, which is shown in the dark red line below. The intersection of this line with the too expensive (dotted green) line is very informative because it shows that at $99, more people regard the price as being too expensive than a bargain. So, if we are focused on maximizing appeal, we will most likely need to price the iLock at a cheaper price.
Now we want to see at what price people start finding it to be expensive, so that the cost is not out of the question, but the buyer would have to give some thought to it, which is represented by the solid green line in the chart below. Where this line crosses with the dotted red line shows what the minimum price should be, which is $50.04. Prices below that, people will find the product as too cheap. Where all of these lines intersect with each other suggests that we need a price between $50-99.
Some people use the price sensitivity meter as an input into the calculation of demand curves. But I find it’s a technique that is most useful if you are trying to get a basic idea of how people value what you’re trying to sell, as it only asks them about perceptions and never directly asks about purchasing.
For more examples on the other pricing research techniques see: Price Salience, Price Knowledge/Awareness, Stated Willingness-To-Pay, Random Assignment, Choice-Based Conjoint.