
Pricing Knowledge/Awareness is our second technique used for pricing research studies. You can find our first technique, Price Salience, here.
The basic idea of Price Knowledge/Awareness research is to compare and contrast what people think they paid versus what they actually paid. This technique is relatively easy, but the hard bit is working out what people actually pay.
The chart below is a scatterplot example of price knowledge/awareness for a confectionary brand. The way we worked out the actual price of the certain brand product in this study was by asking customers where they had made their last purchase. Then with that, we compared prices by looking through various shop’s sales record data. Another way to find this information out is by asking for receipts if they have just left a shop.
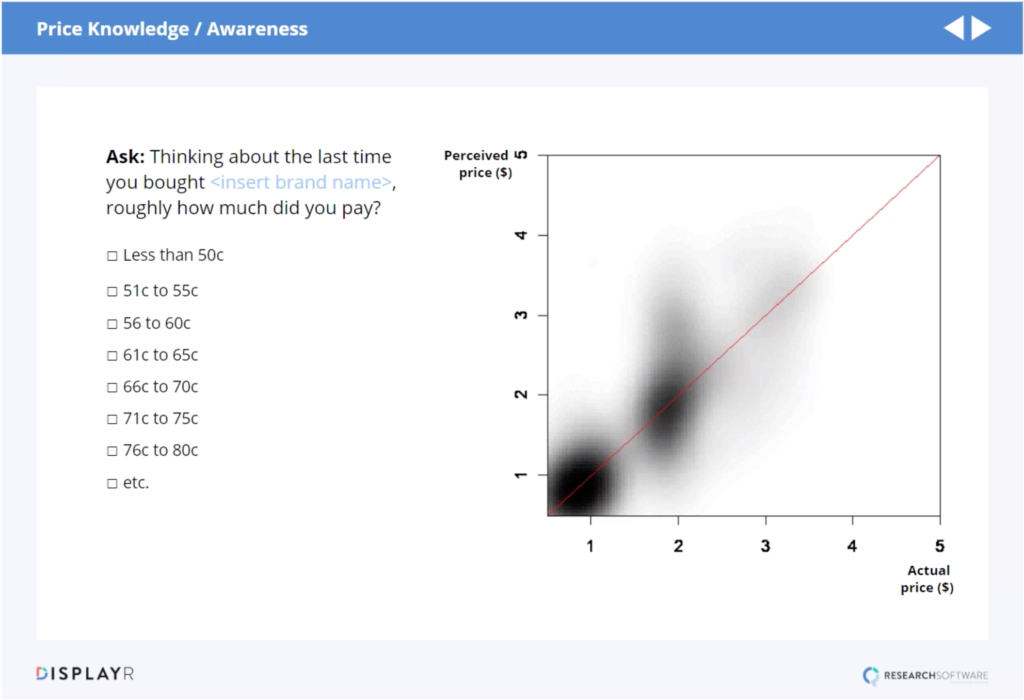
As you gather the guessed and actual price information, you’ll want to plot each price point on a scatterplot. If the people surveyed have a good idea of what they spent, then all of the data will be close to the red line, which represents the actual costs. However, in this category, you can see that the people surveyed had very little idea of what they were paying. On average, people thought they were paying more than what they actually paid; this is shown on the scatterplot with more shading above the red line. Overall, this is great news for the seller as it means they can raise their prices without many negative consequences, which they did.
For more examples on the other pricing research techniques see: Price Salience, Stated Willingness-To-Pay, Price Sensitivity Meter, Random Assignment, Choice-Based Conjoint.