
Every researcher has a chart they have given up on. The one that would land the finding perfectly, that no charting tool offers, and that was never worth a developer’s time.
Displayr’s AI now builds those charts. You describe the visualization you want and the AI writes its code into your document, on your data. What comes back is not a picture. It is a working visualization that filters and weights like any other Displayr object, stays linked to the data, runs from then on without AI, and can be saved as a template your whole team reuses.
The economics of data visualization have changed
Custom charts have traditionally been rare due to the costs required to build. A default chart takes seconds, and polishing it into something clear and attractive takes minutes. It is only once you step outside what your software offers that the bill jumps: a one-off bespoke visualization can be weeks of work, while a reusable custom chart could take months.
This is because a one-off chart only has to work once, on data you can see in front of you. A reusable one has to survive everything you cannot see yet: new series names, extra categories, a wave where a brand drops out. Handling all of that properly meant months of engineering and tens of thousands of dollars, which is why so few of these charts were ever built.
Three things AI has not changed
Even with AI dramatically improving the charting workflow, you still have key responsibilities when building a reusable visualization.
- Trustworthy. Build your tables first, check them independently, and visualize the checked tables. AI makes mistakes. A visualization should always trace back to numbers you have verified, not to numbers the AI produced along the way.
- Responsive. The chart has to stay correct when the data changes. Test it before you trust it: merge categories, reorder them, swap in a different table. Things break here, and it is much better to find out at your desk than in a client meeting.
- Reusable. A chart that only works on the data it was born from is a one-off. Making it genuinely reusable is a deliberate act: decide which settings belong in the Properties panel, and tell the AI up front how the chart should handle categories that did not exist last wave.
7 custom data visualization examples built with AI
These are seven real custom data visualizations, each built with AI on real survey data. Each links to a page with the input data, an example, the finished visualization and the complete prompt that produced it.
1. Proportional images
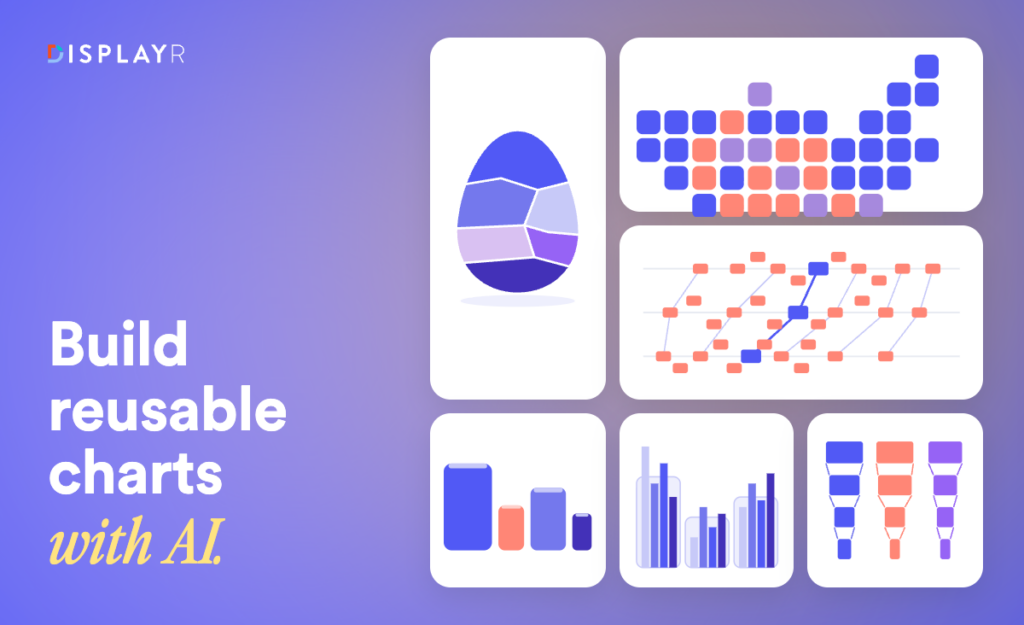
A chart where bars are replaced by pictures, each scaled in area to the value it represents. For brand and category work it reads instantly, because a client recognizes a pack shot faster than a bar. The example shows preference across six colas, each pack sized to its share, with percentages underneath.
This one came from a single short prompt and worked almost immediately. The hard part was not the chart. It was sourcing clean, comparable images of the products, which was done with a separate image tool.

See the data, the output, and the full prompt here.
2. Custom bar charts
The bar chart is the workhorse of market research and almost never does exactly what the brief asks. This one shows counts and percentages together, governed by a single row-height control that scales every element in proportion, and it validates its own input, returning a clear error if the table does not contain both statistics.

See the data, the output, and the full prompt here.
3. Grid cartograms
A standard map gives the most space to the emptiest places. A grid cartogram gives every state one equal square in roughly its geographic position, so the eye reads the result rather than the land area. The example maps the 2024 US presidential election by state.
The interesting decision is the color scale. A continuous gradient would be misleading here, because above fifty percent a result is a win, not a darker shade of maybe. So each state is colored solid blue or solid red, and only the states close enough to the fifty percent line to be in doubt are blended between the two. How close counts as in doubt is a control on the chart, set to five points either side by default. States with no data show grey.

See the data, the output, and the full prompt here.
4. Clustered columns with totals
Clustered columns show the parts. Clients ask for the total. Putting both on one chart usually ends in a manual PowerPoint edit. Here the total sits behind each cluster as a rounded rectangle, so it reads as context rather than competing with the columns.
It is also a useful lesson in not doing everything in one prompt. The base chart was built in Displayr normally, the rectangles were added by hand, and the AI was then asked for the custom tooltips and the legend. Mixing the two approaches is often faster than describing the whole thing from scratch.

See the data, the output, and the full prompt here.
5. Brand health conversion funnels
One column per brand, running from awareness down through consideration and trial to purchase, with the conversion rate between each pair of stages shown on the connecting lines. The conversions are significance tested using the standard errors, so a brand converting unusually well or badly at a given step is colored rather than left for the reader to spot.
The statistics were specified in the prompt as explicit formulas rather than described in words. When the maths matters, writing it out is faster than hoping it is inferred.

See the data, the output, and the full prompt here.
6. Labeled bee swarms with parallel coordinates
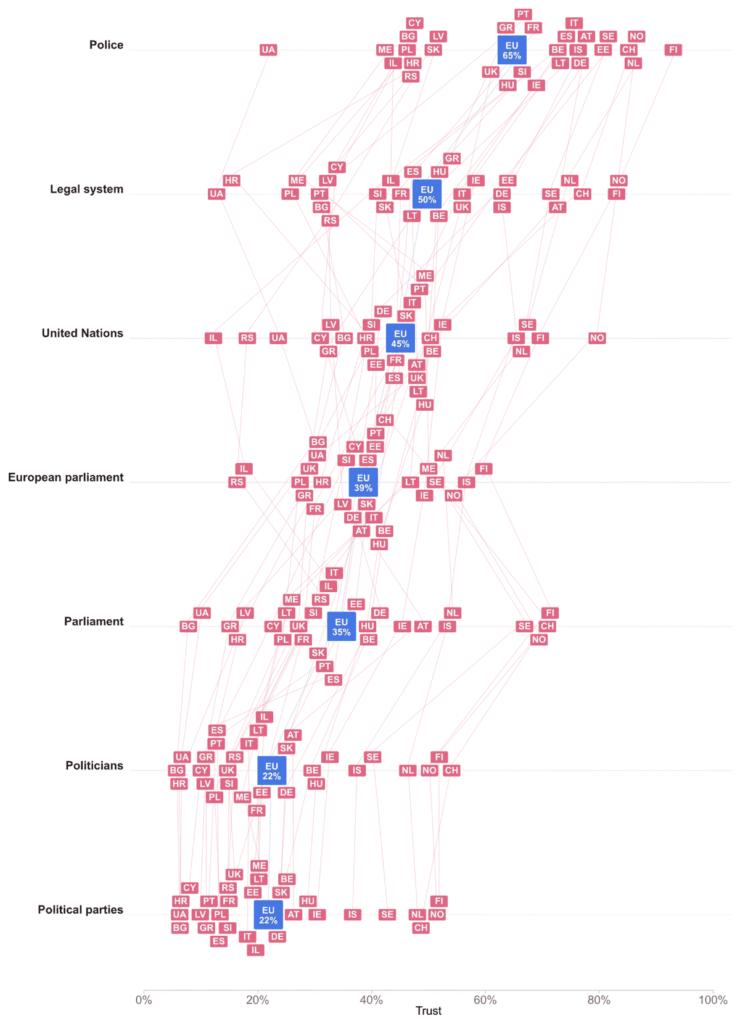
A bee swarm shows every data point rather than an average that hides the spread, packing labeled tiles along an axis without letting them overlap. The example plots trust in institutions across European countries, one row per institution, with the European average shown as a larger tile. Turn on connecting lines and it becomes a parallel coordinates chart, following each country across every row, and hovering over one country highlights it everywhere it appears.
See the data, the output, and the full prompt here.
7. Voronoi treemaps, and an actual Easter egg
A treemap divides a rectangle into areas proportional to value. A Voronoi treemap drops the rectangle, packing each share into an organic cell instead, which suits lopsided shares and any outline that is not a box. The example packs chocolate brands into the shape of an egg, in shades of brown, sitting inside the image behind it.
It is also the most honest example in the set. The first attempt took about fifteen minutes. Getting it genuinely right took about an hour of prompting. The AI found this a hard problem, which is worth knowing before you attempt something similar.

See the data, the output, and the full prompt here.
Where AI still gets custom visualizations wrong
All seven charts above were built live, and several of them failed first. Some common reasons why the AI can sometimes get it wrong include:
- Spatial reasoning is weak. The grid cartogram put several states in the wrong place. New England came out wrong and New Jersey was not below New York. It took an explicit instruction stating that relationship to fix it. If your chart depends on geography or layout, expect to check it square by square.
- It infers meaning you did not intend. In the bee swarm, the AI treated vertical position as meaningful. It is not: only horizontal position carries the value. That had to be said outright.
- Fine detail arrives last. Labels overlapping the connecting lines on the funnel, animation missing from a chart that needed it. These are the final ten percent and they usually take another pass.
None of this is a reason not to do it. An hour of iteration against months of engineering is still the best trade in the table. But plan for the iteration rather than being surprised by it.
How to prompt AI for a custom visualization
Prompting AI is a lot like briefing a person. Give detailed instructions and you get what you asked for quickly. Leave room for interpretation and you get something defensible that is not what you meant, and you iterate. Neither approach is wrong, and a colleague produced a close version of one of these charts in two sentences. But if you know exactly what you want, saying so is the fastest route.
- List every requirement you know about. Hold something back and the AI will find a solution that satisfies what you asked for but is a dead end for what you need.
- Do not invent requirements. Padding instructions with technical-sounding detail you are unsure about makes things worse. If you do not know the right term or approach, say so.
- Be precise. Exact terminology, formulas, reference images and measurements beat vague instructions nobody can check.
- Say what to keep, what to change and how it should behave. Keep the colors and category order. Replace the legend with labels beside each line. Wrap long labels when the chart narrows, without changing the font size.
- Check and iterate. Test with different inputs. When something is wrong, explain what is wrong and how it should be different.
One rule underpins the rest. When the result is not what you wanted, assume your instructions were inconsistent before you assume the AI made a mistake. Usually they were.
Using custom visualizations in dashboards and PowerPoint
Custom visualizations work in Displayr dashboards and reports, and export to PowerPoint.
Be aware of one trade-off. A custom visualization arrives in PowerPoint as a picture, so its data cannot be edited there the way a standard chart’s can. That is the price of being able to draw anything you can describe, and it is worth weighing per project: if a client needs to edit numbers in the deck, a standard chart may serve better.
Available now
Custom visualization is available to all Displayr customers and trialists today. It joins the work Displayr’s AI already does: cleaning survey data, coding open ends, building tables, running analysis, and writing summaries and recommendations. For a closer look at how you can build these visualizations in Displayr check out our Build Your Dream Visualization webinar.
Frequently asked questions
Does the chart need AI every time it runs?
No. The AI writes the chart’s code once. After that the visualization runs on its own, with no AI involved, every time the document opens or the data refreshes. That is also why a colleague can reuse your template without spending anything.
Does the AI get it right first time?
Often, for simpler charts. For complex ones, expect to iterate. The most intricate example in the webinar took about an hour of prompting, against months of engineering for the equivalent built by hand.
Can I edit the chart after the AI builds it?
Yes. The code sits in your document. You can read it, change it, and keep your changes.
What happens when new data arrives?
The visualization stays linked to your data and updates. You specify in advance how it should handle new categories and missing values. Test this before you rely on it, by merging categories and swapping tables.
What makes a custom visualization reusable?
The controls you expose in the Properties panel: the input table, colors, fonts, decimal places, sizes and limits. Set those up and the chart works on any comparable table, not just the one you built it from.
Do filters and weights apply to custom visualizations?
Yes. A custom visualization is a Displayr object like any other, so filters, weights and rules apply, and it can be driven by a table in your document rather than a static copy of the data.
Does building custom visualizations cost extra?
Building uses AI, and AI usage is capped. Heavy users can buy more tokens.
Can I export custom visualizations to PowerPoint?
Yes, as a picture. It will look exactly as designed, but the data cannot be edited in PowerPoint the way a standard chart’s can.