

Sentiment analysis allows you to quickly gauge the mood of the responses in your data. X (formerly known as Twitter) provides a sea of information, and it can be hard to know what to do with it all. When people post their ideas and opinions online, we get messy, unstructured text. Whether it’s comments, tweets, or reviews, it is costly to read them all. This article takes a brief look at what sentiment analysis is and how it can be used to interpret some some of Donald Trump’s tweets.
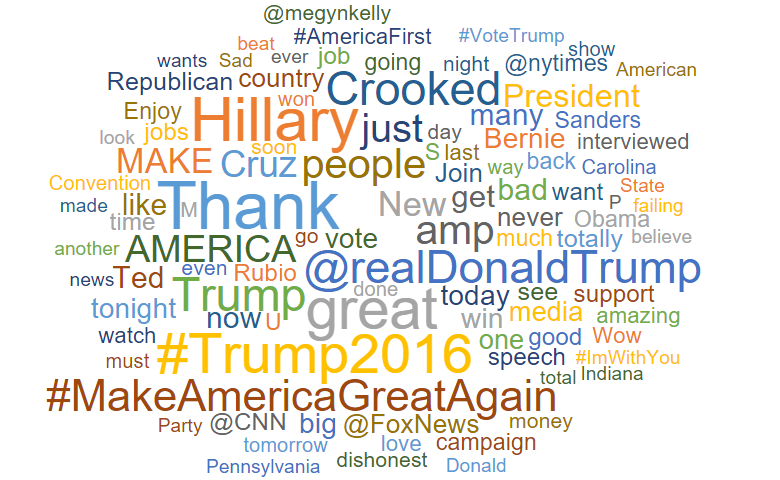
If you are wondering how to analyze X data, there are a couple of different ways. One of the simplest is to do a word cloud visualization with a sentiment analysis of tweets. See this post for an example of a word cloud based on X sentiment analysis.
After all, with everyone’s social media experience being so fragmented and individualized, it can be hard to gauge X sentiment and whether it is positive or negative from a single feed. Analyzing X data and doing a sentiment analysis with tweets can be much easier than you think.
What is sentiment analysis?
Sometimes known as opinion mining, sentiment analysis is the process of contextually mining text to identify and categorize the subjective opinions expressed by the writers. Normally it is used to determine whether the writer’s attitude towards a particular topic or product, etc. is positive, negative, or neutral. It is also often use by businesses to help them understand the social sentiment of their brand, product or services while monitoring online conversations. In the context of X sentiment analysis, at its simplest, sentiment analysis quantifies the mood of a tweet or comment by counting the number of positive and negative words. By subtracting the negative from the positive, the sentiment score is generated. For example, this comment generates an overall sentiment score of 2, for having two positive words:
You can push this simple approach a bit further by looking for negations, or words which reverse the sentiment in a section of the text:

The presence of the word don’t before like produces a negative score rather than a positive one, giving an overall sentiment score of -2.
Ready to analyze your text?
Start a free trial of Displayr.
The process of reducing an opinion to a number is bound to have some error. For example, sentiment analysis struggles with sarcasm. But when the alternative is trawling through thousands of comments, the trade-off becomes easy to make. A little sentiment analysis can go a long way when you’re looking to gauge overall sentiment on a topic. This is especially true when you compare the sentiment scores with other data that accompanies the text.
How to analyze tweets – an example of sentiment analysis using Donald Trump’s tweets
During the election campaign of 2016, much discussion revolved around who was sending out Donald Trump’s Tweets. A number of articles described how the tone of Trump’s tweets are more positive when they come from an iPhone device, than when they come from an Android. The hypothesis is that Trump tweets from an Android device, and that he employs social media assistants who tweet from an iPhone. But how do you work that out? Let’s do a tweet analysis.
You add the sentiment scores to a data set, and then compare the sentiment scores for the different devices. You can try this example out for yourself in Displayr.
In a data set containing 1,512 tweets from @realDonaldTrump sent during the primaries, there is a small but positive average sentiment score of 0.3, with scores ranging from -5 to 6. This means that the average tweet has slightly more positive language than negative. The magnitude of the scores is small as the length of a tweet is restricted.
The power of sentiment arises when considering other variables in the data. Think of the now-famous example of the Trump sentiment gap between Android and iPhone. The mean sentiment score of Tweets from Android, 0.1, is significantly lower than the overall average of 0.3:
If these mean scores don’t sway you, then you may find the shape of the distribution more convincing:
The iPhone has a greater proportion of neutral (0) and slightly-positive (1) tweets. The Android has fewer such tweets, and a greater proportion of tweets with a negative score.
Engagement
The data from X includes the number of times each tweet has been Favorited. This is used as a proxy for engagement. For this data set, the average is around 19,000. By considering how the average number of favorites varies with the sentiment, we discover another interesting pattern.
Those tweets which have a negative sentiment (scoring -2 or fewer) garner a significantly higher number of favorites on average. It would seem that Trump’s followers are noticeably more engaged by negative content.
A little sentiment analysis can reveal patterns in the data which would be difficult to gain by reading through the sea of content.
You can analyze Donald Trump’s tweets yourself by clicking the button above!
Acknowledgements
Thanks to David Robinson for his blog post which inspired my recent thinking on sentiment analysis and text analysis.
Try Displayr’s text analysis software for free today.