

If you haven't yet read our article on "Will Banning Plastic Bags Save the Planet" make sure you check it out first!
Creating a pictograph bar chart
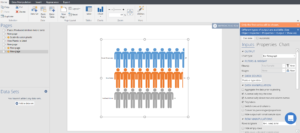
Open Displayr and create a new document. Click Insert > Visualization > Pictograph > Bar Chart. If you have already imported your data, select the data set you want to chart under Data Source. For our visualization, I only had a small amount of data, so I entered it manually. Under the Inputs tab in the Object Inspector, click Paste or type data. You can copy your data from a spreadsheet or just type it in.
Customising your chart
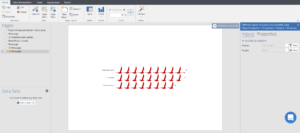
As you can see, your data will appear as a pictograph bar chart with the default "stick man" icon. Now to make it your own w ith a custom pictograph! To do this, you will need a suitable icon. This needs to be an image which is available online (I'll show you why in a minute!). However, if you want to use your own image, just upload it to any online platform. I chose this image of a seabird, as it links to the topic of my data nicely.
Next, we're going to input our icon into Displayr. To do this, go into the Chart tab of the Object Inspector and select the drop down menu next to Icon. Select Custom Icon. This will bring up an "Icon URL" box. Paste the URL of your image into this box (this needs to be the URL of the image itself, not the page it's hosted on - right click the image and select "Copy image address" to make sure you have the right URL). This should turn your stick men into seabirds, or anything else your heart desires!
Adding unfilled icons
That looks great, but our data isn't the number of seabirds that have eaten plastic, it's expressed as a percentage. To show this more clearly, we want to visualize our data as the number of icons out of 10 which are filled in, with each icon representing 10% of the total. In order to do this, we need a copy of our icon in a different color. You can use image editing software to easily change the color of your icon, or you can use a website such as flaticon which allows you to change the color of your icon before downloading.
Under the Chart tab, paste the URL of your different colored icon into the "Base icon URL" bar.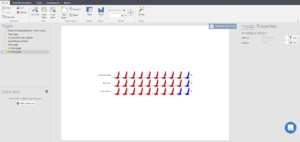
Awesome! If you want to change the number of icons per line, or the number of units per icon, you can do all that under the Chart tab. You also have a bunch of options to customise your chart however you please.
There you have it - how to create your very own custom pictograph in Displayr!
Read more of our fascinating data stories and check out more of our tutorials here!