
The choice simulator is one of the main objectives of choice-based conjoint analysis. This allows you to predict the effect of different scenarios on preference or market share. For this case study, we have used the cruise ship data set which Sawtooth supplied in their 2016 modeling competition. This post assumes you have already created your simulator using a conjoint model in Displayr.
Modifying your simulator
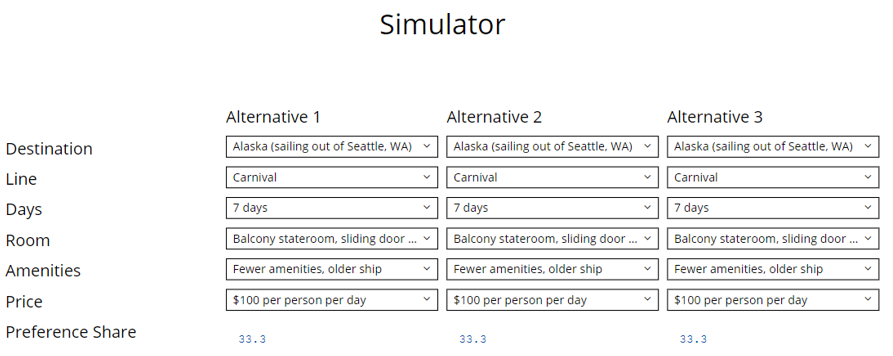
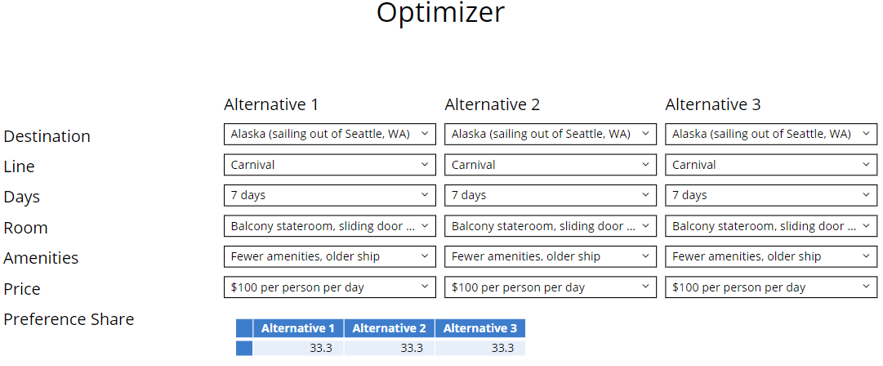
In our example, we have created a basic simulator with 3 alternatives:
There are various ways of modifying your simulator, including weighting and making adjustments to reflect market share. Here, we intend to add a combo box for filtering our preference shares by a specific survey question. We will use likelihood to travel in the next 10 years.
Connecting your simulator to a combo box
The best location for this combo box is on the Page Master which is accessible via Appearance > Page Master. This will allow the same control to appear on every page using this template while retaining the user selections.
We can create our own title page by selecting Title Only and pressing Home > Duplicate. We will rename this ‘Page with Combo box’.
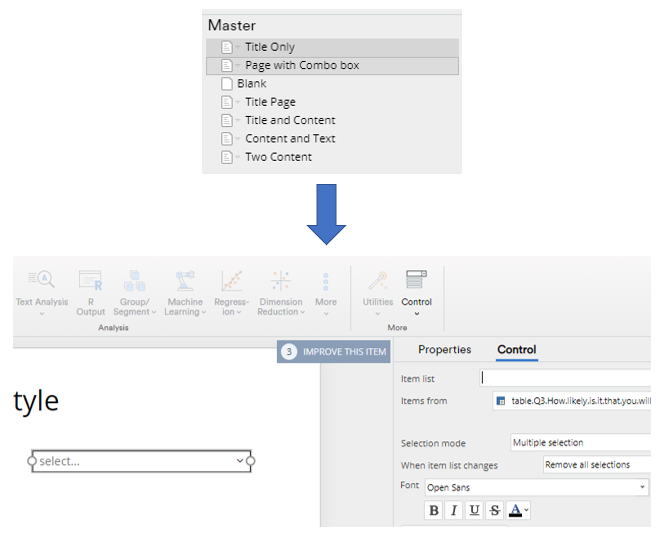
To add the control item, go to Insert > Control > Combo Box. We then connect Items from to an existing table for likelihood to travel. Alternatively, you can just paste the label options separated by a semi-colon into Item list. In this case, we will also need to delete the default items there. Next, we change Selection Mode to Multiple selection. You can also optionally change the name under Properties > GENERAL.
We can now go back via Appearance > Normal and change the simulator page via Home > Layout > Page with Combo box.
With Displayr, you can easily filter data using a combo box with an R variable. As we are using a single-response question but wish to allow multiple selections, we need to first make it binary via Insert > Filter > Filters from Selected Data. You should then select the appropriate respondent data file under Data Sets and go to Insert > R > Numeric Variable. For a multiple-response combo box, the filter formula to use in the R CODE field is as follows:
rowSums(`Question_name`[, combo_box_name, drop = FALSE]) > 0
The Question name can simply be dragged over to this field from Data Sets to look like this:
rowSums(`Q3: How likely is it that you will take a cruise vacation sometime in the next 10 years? - Filters`[, Combo.box, drop = FALSE])> 0
This code will filter Q3 to the items selected in ‘Combo.box’. It will then only include the respondents who fall into these categories.
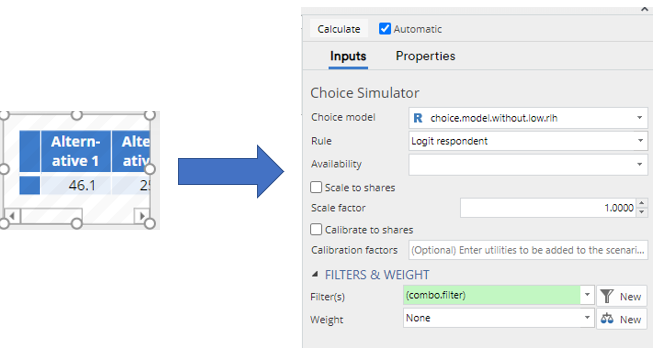
Next, tick Usable as a filter. We will name this ‘combo.filter’. Now you can go back to your simulator page and apply ‘combo.filter’ to your ‘preference.shares’ output under FILTERS & WEIGHT > Filter(s).
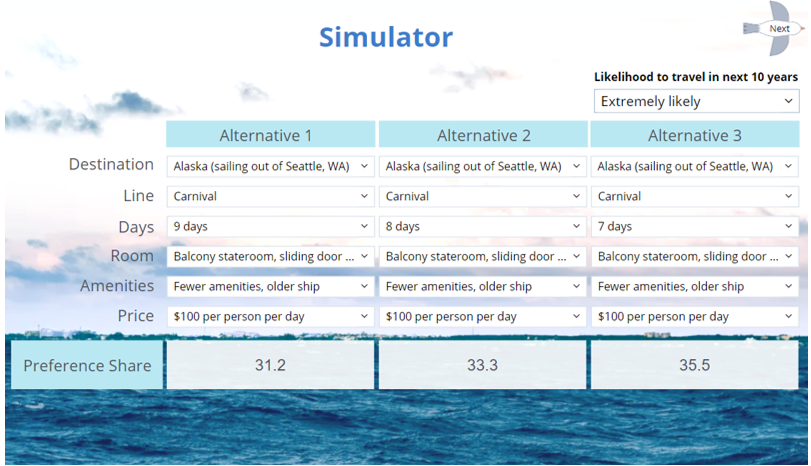
Below is the formatted version of our simulator:
Weighting your data by alternative-specific respondent preference shares
Displayr allows you to complement your simulator with further visualizations that help tell the story of your data. One way to make further use of our simulator is to weight our demographic questions by a selected alternative’s preference share results.
We will begin by making a new page with the same default combo box via Home > New Page > Page with Combo box. We will now copy the ‘preference.shares’ output from the simulator page via Home > Duplicate and drag it over to the new page to get the respondent-level results.
First, we need to remove the combo box filter from the output. We then need to paste the below code at the bottom of Properties > R CODE:
preferences.by.respondents = data.frame(matrix(resp.shares, ncol=3))
colnames(preferences.by.respondents) = c("Alternative 1","Alternative 2","Alternative 3")
preferences.by.respondents
You will need to change the ‘ncol’ reference and column names to match the number of alternatives in your simulator.
The next steps involve creating the combo box filter. In the menu ribbon, select Insert > Control > Combo Box and paste Alternative 1; Alternative 2; Alternative 3 in Item list. I have named this combo box ‘cCruise’.
Next, create the filter variable via Insert > R > Numeric Variable and paste the below into the R CODE field:
preferences.by.respondents[, cCruise]
This code will filter ‘preferences.by.respondents’ by the alternative number selected in ‘cCruise’. Once you tick Usable as a weight, this can be applied to your outputs under Inputs > FILTERS & WEIGHT > Weight.
This allows you to add visualizations for various demographic questions with the combo box filter and weight applied to the source tables. Remember to drag the tables off the page and select Appearance > Hide. You can also use a variety of conjoint-specific visualizations, such as a demand curve for the price attribute.

Creating an optimizer
An alternative to creating an online simulator is to create what we call an ‘Optimizer’. Unlike a simulator, an optimizer allows multiple selections per attribute and generates multiple-preference share combinations at the same time.
To create an optimizer, you can either select your conjoint analysis output and click Inputs > SIMULATION > Create optimizer or go to Insert > More > Conjoint/Choice Modeling > Optimizer from the ribbon. You will need to then specify the number of alternatives and whether you wish to include alternative-specific attributes. We will choose 3 here and disregard the alternative attribute. This will create a page called ‘Optimizer’.
Similarly, we will also apply our combo box filter to the preference share output on this page.
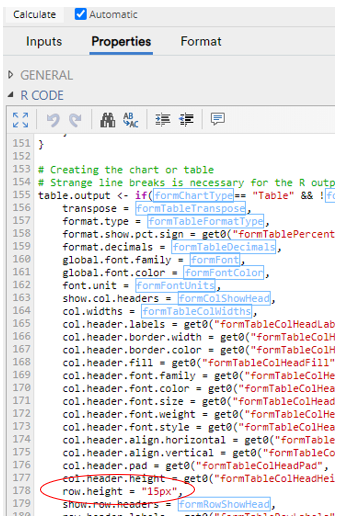
Again, you can format the page objects as desired. In this case, an Autofit table provides more flexibility for the summary preference share table as you can easily drag the edges to align with the optimizer’s columns. You can create this via Insert > Paste Table, ticking Autofit, and selecting this page’s preference share output under DATA SOURCE.
Due to the varying size of the table, we can fix the height to ensure it adds a scroll bar. We will add row.height = "15px", to Properties > R CODE where the row specific fields are.
We can now select the original output, drag it off the page and press Appearance > Hide to ensure it remains hidden from the published version of the document.
Using your optimizer
One specific use case for the optimizer is fixing the options for the second and third alternatives while selecting multiple options for the first alternative. In the first column, we will select all the options under Room, Amenities, and Price to generate the 30 combinations for the multi-selected combo boxes.
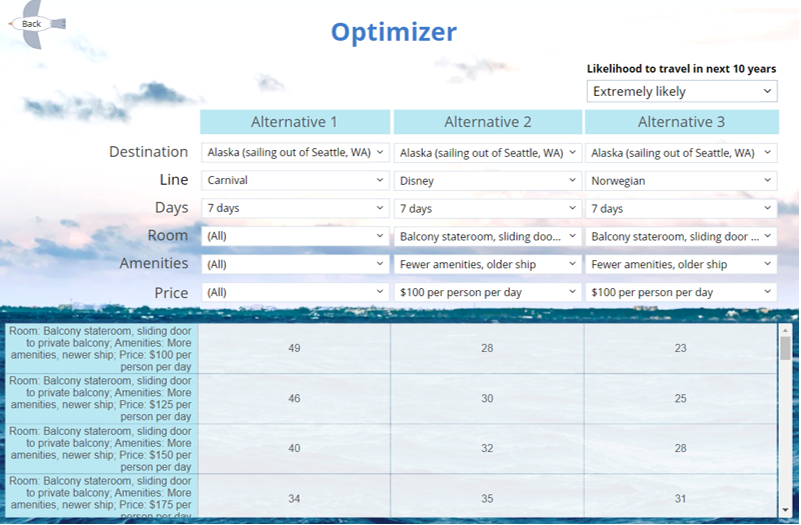
A benefit of autofit tables for this scenario is we can automatically pre-sort the table from highest to lowest by the first column. Simply go to Inputs > ROW MANIPULATIONS, tick Sort rows, place ‘1’ in Column used for sorting rows, and tick Sort in decreasing order.
You can see the finished document here.