

TURF analysis (Total Unduplicated Reach and Frequency) is a market research technique that finds the combination of products, flavors, or messages that reaches the most people with the least overlap. Instead of picking the individually most popular options — which often appeal to the same people — TURF finds the portfolio that maximizes unduplicated reach.
TURF analysis is one of the most powerful techniques for a market researcher to have in their arsenal. It’s how they identify the mix of products and services that customers will actually love – based on real-world data.
But TURF is complex, particularly when it comes to preparing your data so that it can be effectively analyzed. With this guide, you should be able to get your head around the basics of TURF analysis and set yourself up for market research success.
What is TURF Analysis?
TURF is an acronym for Total Unduplicated Reach and Frequency. To use TURF analysis effectively, it’s important you understand when (and when not) to use it.
The primary questions TURF sets out to answer are;
- Which products should a company make when it can only support a limited number?
- Which media channels should be prioritized for maximum reach?
The easiest way to understand TURF analysis is to look at how it might operate in a real-life scenario.
TURF Analysis in Action
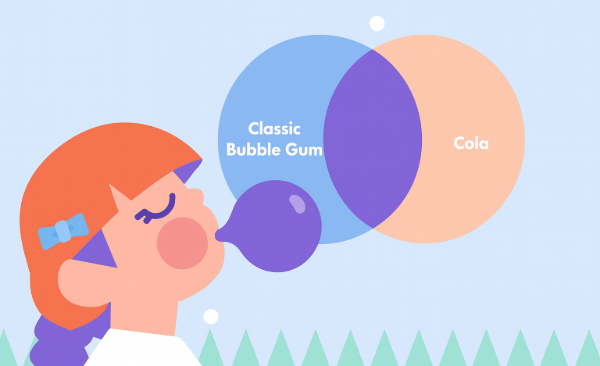
Imagine a bubble gum manufacturer currently selling two flavors wants to expand its range to four. To make the best decision, the company surveys 712 parents, asking which of 11 possible flavors their children like.
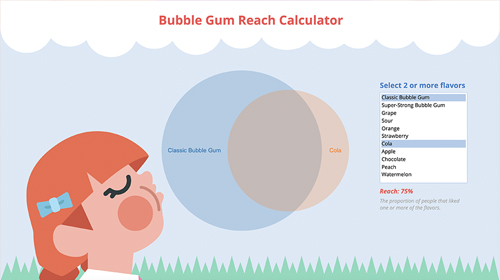
TURF analysis is then used to determine which combination of four flavors will maximize the number of children who like at least one of the flavors – this is what we call the total unduplicated reach (this is usually just shortened to ‘reach’). In other words, the company wants to pick the four flavors that together will appeal to the largest possible group.
This TURF study would work by;
- Testing all possible combinations of the four flavours
- For each combination, TURF calculates the percentage of children who like at least one of those four flavors
- The combination with the highest reach is considered the best option
It’s also important to talk about the ‘F’ in TURF – frequency. In this example, the frequency would be the total number of flavors liked by individuals across the sample.
Whether you look more closely at the Reach or the Frequency will depend on the problem you are trying to solve. When it comes to TURF analysis in media planning, there is a belief that seeing an ad more than once makes it more effective, and therefore, Frequency is important. However, in the bubblegum flavor example, the goal is to appeal to the largest percentage of potential customers, so the focus is on Reach.
How To Prepare Your Data For TURF Analysis
Although incredibly useful, one of the biggest drawbacks of TURF analysis is that it requires a large sample of respondents to work effectively. Displayr suggests that a TURF study should consist of data from at least 100 people (but ideally much more).
This is because the differences between alternative products or media portfolios are often very small, sometimes less than 1%. To detect and trust these subtle differences, you need enough data to minimize the risk of random sampling error skewing your results. For studies with important strategic implications, sample sizes in the thousands are recommended.
The data should also be set up in a binary format where;
- Rows represent observations (people)
- Columns represent alternatives (products)
- There is a value of 0 or 1 in each cell (0 indicates the person does not like the product, 1 shows that they do like it)
Data from rating scales (such as purchase intent) can be used effectively for TURF; however, it is still important that this is converted into binary data. For example, assigning a 1 to everybody who has said “Definitely will buy” and “Probably will buy” and a 0 to everybody else.
Other common data sources include historic purchase data, MaxDiff, conjoint utilities, or preference predictions.
Handling Missing Data
TURF analysis does not work when there is missing data. This is because TURF requires every response to be coded as a clear “1” (the alternative is liked or chosen) or “0” (not liked or chosen). If there are missing values, TURF cannot accurately calculate reach and frequency, which undermines the reliability of the analysis.
Imputing missing data is also highly problematic for TURF. Standard imputation methods, such as replacing missing values with means or regression predictions, break the binary structure required for TURF and can distort results. Even stochastic imputation (randomly assigning a 1 or 0) adds noise and reduces the trustworthiness of the findings. The more noise introduced through imputation, the less reliable your TURF results become.
Advanced TURF Techniques and Visualization
A TURF analysis can only tell you so much. Data visualization techniques and (sometimes) further analyses can be used to tell the full story. Examples here include;
- Constraining Alternatives: Often, businesses need to ensure certain products or media channels remain in every portfolio – such as existing best-sellers. Advanced TURF allows you to “lock in” these must-haves (e.g, a specific bubblegum flavor), focusing analysis on realistic, actionable combinations.
- Duplication Matrix for Substitution: A duplication matrix reveals how much overlap exists between alternatives, helping you identify which products are substitutes. This matrix helps avoid redundant combinations, ensuring your portfolio reaches the widest possible audience.
- Correspondence Analysis: Applying correspondence analysis to the duplication matrix helps visualize substitution. This technique maps alternatives in two dimensions, showing which options are similar or distinct. Ideally, you want to select alternatives far apart on this map, maximizing unduplicated reach.
- Venn Diagrams and Upset Plots: Venn diagrams are intuitive for visualizing overlap between a small number of alternatives, while upset plots handle larger, more complex portfolios. Both tools help you instantly see unique and shared appeal, supporting clear communication and smarter decisions.
- Principal Component Analysis: For even deeper insight, principal component analysis (PCA) can summarize complex substitution patterns, highlighting the main dimensions of difference between alternatives. This guides you toward more diverse, high-impact portfolios.
TURF Analysis Example
Here’s a quick TURF analysis example to show how the TURF method (short for Total Unduplicated Reach and Frequency) works.
A snack brand is testing ten new chip flavors with 800 consumers to identify the top four for reaching the widest audience. Using TURF modeling in Displayr’s TURF software, every combination is tested automatically. The winning mix — “Smoky BBQ,” “Sea Salt,” “Sour Cream & Onion,” and “Chili Lime” — reaches 92% of consumers who like at least one flavor.
This TURF modeling approach helps brands find the product or media mix that maximizes unduplicated reach without overlap. Run your own TURF analysis in Displayr to quickly identify combinations that deliver the biggest impact.
Step-by-Step Guide to TURF Analysis
TURF analysis is an iterative process. It takes time to collect and prepare the data, then accurately interpret the results. By breaking it down into simple and manageable steps, you give yourself the best chance of success. Here’s a rough map of a TURF analysis, from beginning to end:
1. Define Goals: Clarify what you want to achieve, whether it’s selecting products or media channels. List all possible options to test.
2. Collect (Enough) Data: Gather responses from a large enough sample (ideally hundreds or more). Ensure respondents indicate which options they like or would choose.
3. Prepare Your Data: Set up a binary matrix: rows for respondents, columns for options, and cells coded 1 (liked) or 0 (not liked). Convert rating scales into binary form (e.g., “Definitely will buy” = 1, others = 0). Avoid missing data—it breaks TURF calculations.
4. Run the TURF Analysis: This is where having a dedicated tool, such as Displayr, is so valuable. If using Displayr, specify how many options to select (e.g., best 4 of 11). The software tests all combinations and calculates total unduplicated reach. The combination with the highest reach wins.
5. Interpret Reach and Frequency: Reach shows how many unique people are covered by your selection. Frequency indicates how many options each person likes. Focus on reach for product choices; frequency can matter more for media planning.
6. Apply Advanced Techniques: Lock in must-have options, analyze overlap with duplication matrices, and visualize results using Venn diagrams or upset plots to avoid redundancy.
7. Share and Act: Create dashboards and charts to communicate insights clearly, helping your team make smarter, data-driven decisions.
Running it yourself takes minutes in TURF analysis software – upload your survey data, pick the variables, and the simulator finds the optimal portfolio.
Excel vs R for TURF Analysis
You can use both Excel and R to perform TURF analysis; however, both come with significant drawbacks.
In Excel, the process starts with setting up a binary matrix where rows represent people and columns represent products or media options. From there, you’d manually (or with complex formulas or VBA) test all possible combinations of a given portfolio size – calculating total unduplicated reach for each one. This can be effective for small studies, but as mentioned above, TURF analysis usually involves large sample sizes.
R is a much more effective option when it comes to TURF analysis. However, there’s no standard TURF package, so there is a lot of manual work required.
TURF in Displayr
With Displayr, TURF analysis is easy and efficient. The automated TURF output shows you the key conclusions from your data – without the distractions. Plus, you can visualize your findings and perform advanced analysis as needed.