

Analyzing quantitative research data has long been one of the most complex (and time-consuming) aspects of the market research process.
While AI has transformed the industry in recent years, much of that innovation has centered on qualitative analysis: automatically categorizing open-ends, scaling up text analysis, and making sense of unstructured feedback.
But now, AI is catching up on the quantitative side. Emerging tools can take raw numeric data and deliver fast, meaningful insights – complete with the statistical rigor that researchers expect.
This guide covers everything you need to know about using AI for quantitative research: from preparing your data for AI-powered analysis to choosing the best tools to streamline your workflow.
Challenges of Traditional Quantitative Research
Quantitative research focuses on what can be measured — most often the structured data gathered from surveys and questionnaires, rather than open-ended responses.
While this structured format allows researchers to apply a wide range of statistical methods, the analysis process comes with major challenges. These techniques are often highly technical, require specialized expertise, and can be both time-consuming and error-prone — potentially undermining the validity of the results.
Before analysis even begins, cleaning the data presents its own set of hurdles:
- Detecting straight-lining, outliers, and inconsistencies
- Effortlessly removing or transforming problem data (e.g., deleting, capping, merging, rebasing, recoding)
- Tidying data quickly through actions like banding, aggregating, back-coding, and weighting
- Speeding up workflows with customizable templates
Even after analysis, the reporting stage can be a bottleneck. Creating visualizations, surfacing insights, and updating PowerPoint decks remain labor-intensive tasks that slow down delivery.
The Rise of AI in Quantitative Research
While AI quickly integrated into the qualitative research workflow (mainly due to the way Natural Language Processing (NLP) excels at analyzing text) the same can’t be said for quantitative analysis.
Numbers present a different set of challenges: AI must not only recognize patterns in structured datasets but also handle statistical rigor, sampling logic, and methodological constraints. Unlike text, where “meaning” can be derived through context, quantitative data demands careful application of the correct statistical techniques to avoid misleading conclusions.
The fact that quantitative data analysis is so specialized has been one of the main reasons AI has not had the same transformative impact as it has with qualitative research. This is because accuracy is so essential when it comes to market research.
But as models have improved—and researchers have gained a deeper understanding of how AI interprets different types of data—new opportunities have opened up for quantitative analysis.
Use cases such as tracking studies, new product development, brand analytics, and generating multiple crosstabs have emerged as effective ways to integrate AI into quantitative workflows. This is because AI can now reliably handle structured datasets, automate repetitive statistical tasks, and surface patterns that would otherwise require extensive manual analysis.
Why Use AI for Quantitative Research?
Integrating AI into the quantitative research workflow can transform the way projects are run—reducing tasks that once took hours or days to just minutes. Instead of getting bogged down in repetitive, technical work, researchers can focus on interpretation, data storytelling, and client impact. Some of the main benefits include:
- Build charts and dashboards automatically: One of the most time-consuming aspects of any study is producing clear, accurate visualizations. AI tools can generate dashboards and charts directly from raw survey data, instantly translating numbers into visuals that are ready to explore or present.
- Summarize key findings in seconds: Instead of sifting through endless tables, AI can highlight the insights that matter most to clients—such as shifts in brand awareness, emerging customer needs, or standout product features—making it easier to get to the “so what?” faster.
- Instantly create reports: Beyond summaries, AI can generate complete reports that combine visualizations, statistical results, and narrative explanations. This makes it easier to deliver polished, professional outputs without spending days formatting PowerPoint slides or writing executive summaries.
- Produce editable outputs: Unlike static exports, AI-generated reports and dashboards can remain fully editable. Researchers can drill down into the underlying data, adjust filters, re-cut analyses, or update visualizations as new information comes in. This ensures both flexibility and accuracy.
By automating the heavy lifting, AI doesn’t just save time—it elevates the quality of the analysis, giving researchers more space to think creatively, test new hypotheses, and deliver richer insights to their clients.
Top Tools for AI-Powered Quantitative Research
A number of AI tools are emerging to help researchers automate parts of the quantitative analysis workflow. While their approaches differ, the goal is the same: reduce time spent on manual tasks and increase focus on insights.
Displayr
Best for: Market researchers working with survey data.
Displayr is purpose-built for survey data analysis and reporting. And with the launch of Displayr’s Research Agent, AI capabilities now extend into the quantitative research workflow. Capabilities include; generating crosstabs, running advanced statistical analyses, and instantly creating editable reports and dashboards. Unlike general-purpose AI tools, Displayr is designed specifically for market research, meaning outputs are statistically sound and customizable. Researchers can check underlying data, refine analyses, and maintain full control. This makes it the most reliable option for researchers who need speed and accuracy.
Cons: More specialized for survey data than general business analytics; may be more than what’s needed for very simple ad hoc analysis.
Powerdrill
Best for: Streamlining specific survey data tasks.
Powerdrill focuses on automating repetitive tasks in survey research. Its AI features are aimed at simplifying structured data analysis, particularly in survey cleaning, basic statistical testing, and workflow automation. While useful for speeding up some processes, its functionality is narrower compared to platforms that combine data prep, analysis, and reporting in one place.
Cons: Lacks strong visualization and reporting features; more technical to use than other options.
Julius AI
Best for: Quick exploratory analysis of spreadsheets.
Julius positions itself as a general-purpose AI data analysis assistant. It can ingest datasets (often spreadsheets or CSVs), run basic exploratory analyses, and generate visualizations or summaries using natural language queries. However, it is not optimized specifically for market research, meaning outputs may lack the methodological rigor required for complex survey projects.
Cons: Less tailored to survey data or market research workflows; reporting and automation options are limited compared to specialized tools.
Ajelix
Best for: Automating Excel or Google Sheets workflows.
Ajelix began as an AI assistant for Excel and Google Sheets. Its core strength lies in generating formulas, automating spreadsheet tasks, and creating quick data summaries or charts. While helpful for analysts who work heavily in spreadsheets, it lacks specialized quantitative research features like weighting, crosstab automation, or advanced statistical modeling.
Cons: Limited advanced statistical capabilities; not designed for large-scale or complex survey data.
ChatGPT
Best for: General-purpose data exploration and reporting drafts.
ChatGPT can be prompted to analyze datasets, create statistical summaries, or suggest ways of visualizing results. With plugins or code execution enabled, it can process structured data and assist with reporting. However, its outputs depend heavily on prompts, and it lacks built-in safeguards for survey methodology. This makes it better suited for exploratory work or idea generation rather than robust, production-level analysis.
Cons: Accuracy depends heavily on prompt quality; prone to hallucinations with numbers; not designed for handling large datasets natively.
Grapha AI
Best for: Automated data visualization.
Grapha AI is designed to turn raw data into quick, AI-generated graphs and dashboards. It emphasizes automated visualization rather than deep statistical analysis. This makes it useful for fast, top-line summaries, but limited when it comes to applying advanced quantitative techniques or handling complex survey datasets.
Cons: Limited customization and statistical depth; more useful for quick visualization than robust analysis.
Flowtrail AI
Best for: Business users seeking automated dashboards.
Flowtrail AI focuses on workflow automation and data handling, using AI to streamline repetitive tasks like cleaning and organizing datasets. While it reduces the manual burden of data prep, it offers fewer built-in analysis features compared to more specialized platforms. As a result, researchers need to export data elsewhere for deeper statistical work.
Cons: Less suited for statistical research or survey workflows; more focused on standard business metrics.
Best Practices for AI-Powered Quantitative Market Research
Regardless of the AI-powered tool you use, following best practices for quantitative data analysis is essential to ensure accuracy and maximize the effectiveness of your results.
- Design surveys carefully
Before you even start analyzing results, make sure your survey is well-structured. Questions should be concise, unambiguous, and aligned with the overall research objectives. A poorly designed survey will lead to poor data quality, no matter how advanced your analysis tool is. More info here: 6 Ways to Improve the Data Quality of Online Quantitative Surveys - Choose the best possible data file
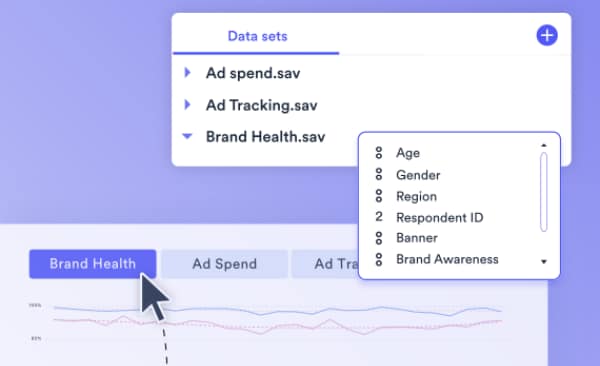
Different tools handle data formats differently. For example, Displayr works best with SPSS.savor compressed.zsavfiles, as they contain detailed metadata that leads to richer, more accurate reporting. Always check which format your tool supports best before uploading data. - Clean your data
Many AI-powered tools now include automated data-cleaning features, and these are becoming increasingly effective. However, if you have the time and expertise, it’s still worthwhile to manually clean your data to some extent to catch issues automation may miss. Learn more about data cleaning best practices. - Check the results
AI is powerful but not perfect. Hallucinations and errors can (and do) occur. Always review outputs to make sure they align with your knowledge of the dataset and research questions. Tools like Displayr’s Research Agent make this easier by producing fully checkable outputs, so you can trace insights back to the underlying data and correct errors when needed.
Turn quantitative data into charts, dashboards, and insights with Displayr’s Research Agent. Ready to get started? Try free today.