


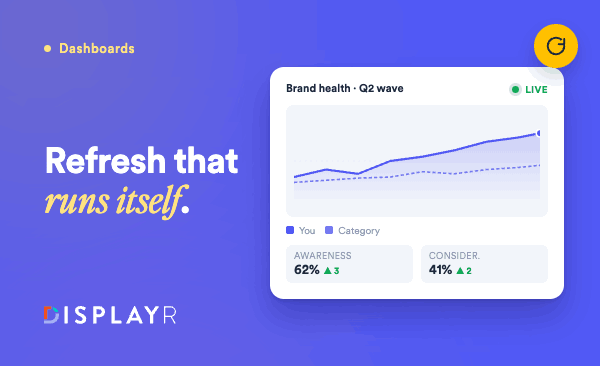
Brand tracking studies are only useful if the data is current. The problem most insights teams run into is getting brand health metrics into a dashboard that stays up to date automatically, runs the right analysis wave over wave, and produces something a stakeholder can read without a researcher rebuilding it each time.
This post ranks nine brand tracking software tools on four criteria: automated dashboard refresh, tracking study analytics depth, survey reporting workflow, and collaboration features for insights teams — in short, which brand tracking platforms with clear dashboards actually keep them clear, wave after wave.
What we evaluated:
- Dashboard auto-refresh and live data connections
- Tracking study analytics depth (significance testing, wave-over-wave trends, driver analysis)
- How much of the reporting workflow is automated
- Collaboration and sharing for distributed insights teams
What to look for in brand tracking software
Not all brand tracker dashboards are built the same way or for the same exact purpose. Before shortlisting tools, be clear on two things.
First, whether your tracker is continuous (responses collect daily or weekly) or wave-based (fieldwork runs in discrete periods). Continuous trackers need robust live data pipelines. Wave-based trackers need efficient data import and wave-over-wave comparison tools.
Second, whether your team needs to build custom analysis or primarily wants to consume automated outputs. A tool that produces great analysis but requires hours of manual configuration per wave is not saving you time.
For a deeper look at how to set up efficient tracking workflows, see our guide to tracking study analytics.
1. Displayr
Displayr is brand analytics software purpose-built for tracking studies. Its dashboards connect directly to live data sources so when new wave data arrives, charts, tables, and commentary update automatically without manual rebuilding.
Dashboard auto-refresh
Displayr dashboards are live by default. Set a refresh schedule and results flow through to every chart and slide automatically. PowerPoint exports stay connected to the live analysis, so decks update when underlying data changes — no copy-paste between waves.
Tracking study analytics depth
Full statistical engine covering weighted crosstabs, significance testing across waves, trend lines, driver analysis, and segmentation. The Research Agent can run the full wave analysis automatically and generate commentary flagging significant changes since the previous wave.
Reporting workflow
Automated from data cleaning through to PowerPoint output. Tracking templates can be saved and rerun on each new wave in one click, making it well suited to recurring monthly or quarterly programmes.
Best for: Insights teams running recurring brand trackers who want end-to-end automation from raw data to client-ready output.
See an example of what a brand tracker dashboard looks like in practice: brand health dashboard gallery.
2. Qualtrics
Qualtrics is the enterprise experience management platform with a mature brand tracking module. It handles complex survey design, panel management, and dashboard reporting within a single platform.
Dashboard auto-refresh
Qualtrics dashboards update as new responses arrive through connected data sources. Continuous collection trackers update in near real-time. Wave-based studies update at the end of each field period.
Tracking study analytics depth
Strong on statistical rigour. Significance testing, benchmarking, and trend analysis are built in. The platform handles complex weighting and quota management well. The iQ analytics layer adds driver analysis and text analytics for open-ended responses.
Reporting workflow
Dashboard sharing and role-based access are well developed for enterprise teams. Report automation is available but requires more configuration than purpose-built tracking tools.
Best for: Large enterprise teams with complex methodology requirements and existing Qualtrics infrastructure.
3. quantilope
Brand tracking is a core use case for quantilope. The platform automates analysis as new data comes in, making it one of the more hands-off options for recurring trackers.
Dashboard auto-refresh
Dashboards update continuously as panel responses collect. Significance testing and trend indicators update automatically without researcher intervention between waves.
Tracking study analytics depth
Purpose-built for tracking. Automated significance testing, KPI trend lines, and norm comparisons are standard. The platform applies best-practice statistical defaults throughout, reducing the risk of methodological inconsistency across waves.
Reporting workflow
Designed to minimise manual steps between data collection and output. Insight summaries generate automatically. Less flexible than open platforms for custom or bespoke analysis requirements.
Best for: Teams who want a largely automated tracking workflow with minimal manual configuration between waves.
4. Forsta
Forsta (formerly Confirmit) is a research platform with deep roots in longitudinal tracking studies. It handles complex multi-market, multi-wave brand trackers reliably, particularly for large research agencies.
Note: as of May 2026 Forsta has been acquired by Qualtrics.
Dashboard auto-refresh
Forsta dashboards connect to live data and update as new responses arrive. The reporting engine is built for wave-over-wave comparisons and handles large data volumes across multiple markets.
Tracking study analytics depth
Strong on complex tracking methodology. Handles hierarchical data structures, multiple response types, and advanced weighting schemes across markets. Driver analysis and multivariate tools are available.
Reporting workflow
Highly configurable but requires technical setup. Better suited to teams with dedicated platform expertise than self-service insights teams.
Best for: Research agencies running large, complex multi-market brand trackers where methodological flexibility is the priority.
5. QuestionPro
QuestionPro is a survey platform with an InsightHub product designed for continuous research communities and tracking studies. It sits at a more accessible price point than enterprise alternatives.
Dashboard auto-refresh
InsightHub dashboards update as responses collect. Real-time reporting is available for continuous trackers. Wave-based trackers require data import at each field closure.
Tracking study analytics depth
Solid for standard tracking KPIs. Trend analysis, crosstabs, and basic significance testing are built in. Less depth on advanced multivariate analysis than enterprise platforms.
Reporting workflow
Dashboard sharing and PowerPoint export are available. Workflow automation is less developed than purpose-built tracking tools but sufficient for straightforward programmes.
Best for: Mid-market insights teams looking for a capable tracking platform at a lower cost than enterprise alternatives.
6. Dynata
Dynata is primarily a data collection and panel provider, but its analytics platform allows clients to run tracking dashboards directly on Dynata-sourced data. It is a natural choice for teams already using Dynata for panel supply.
Dashboard auto-refresh
Dashboards connected to live Dynata panel data update as field work progresses. The analytics layer shows real-time field progress and interim results during collection.
Tracking study analytics depth
Standard tracking KPIs, crosstabs, and trend analysis. The platform is more focused on data delivery than deep analytical flexibility.
Reporting workflow
Output formats are functional rather than presentation-ready. Most teams use Dynata data alongside a separate analysis or reporting tool for final deliverables.
Best for: Teams using Dynata for panel supply who want basic tracking dashboards without switching platforms for reporting.
7. Attest
Attest is a consumer research platform with a strong focus on brand tracking for marketing teams. Its interface is more accessible than enterprise platforms, with automated significance testing and trend reporting built in as standard.
Dashboard auto-refresh
Attest dashboards update as survey responses collect. Trend comparisons across tracker waves are surfaced automatically. The platform is designed for marketing teams to access results without researcher involvement.
Tracking study analytics depth
Well suited to standard brand health KPIs: awareness, consideration, preference, and usage. Less suited to complex custom analysis or advanced statistical methods beyond standard metrics.
Reporting workflow
Clean output with automated insight summaries. Sharing with stakeholders is straightforward. Less flexibility for custom report formats or bespoke deliverables.
Best for: In-house brand and marketing teams running regular brand health checks who need fast, accessible results without deep methodological complexity.
8. Zappi
Zappi is a consumer insights platform focused on brand and creative tracking. Its AI layer analyses results automatically and generates insight summaries, making it one of the faster options for getting from data to findings.
Dashboard auto-refresh
Dashboards update as responses come in. Zappi’s automated analysis runs on new data as it arrives, flagging significant changes without manual review by a researcher.
Tracking study analytics depth
Strong on brand funnel metrics and norm comparisons against Zappi’s benchmark database. Less suited to highly custom tracking methodologies or bespoke analysis requirements.
Reporting workflow
AI-generated insight summaries reduce time to findings significantly. Output is optimised for speed rather than methodological depth or custom formatting.
Best for: Teams who prioritise fast turnaround on brand health read-outs and want AI-generated summaries rather than analyst-built reports.
9. Toluna
Toluna is a panel and survey platform with a Start product for self-serve research. It covers brand tracking use cases at an accessible price point, with dashboard reporting built into the platform.
Dashboard auto-refresh
Toluna Start dashboards update as panel responses collect. Trend tracking across waves is available for recurring studies configured within the platform.
Tracking study analytics depth
Standard tracking KPIs and crosstabs. Significance testing is available. Less analytical depth than dedicated tracking platforms for complex programmes.
Reporting workflow
Functional reporting with export options. Best suited to straightforward tracking studies rather than complex multi-market programmes.
Best for: Teams with limited budgets running straightforward brand trackers who need a self-serve option without enterprise pricing.
Frequently Asked Questions
What is brand tracking analysis software?
Brand tracking analysis software is a platform that collects, analyses, and visualises brand health metrics over time, typically covering awareness, consideration, preference, and usage. It tracks how these shift across consumer segments in response to marketing activity, competitor moves, or broader market changes, and surfaces the results through dashboards that update wave over wave.
What does auto-refresh mean for a brand tracker dashboard?
An auto-refresh brand tracker dashboard updates its charts, tables, and metrics automatically when new data arrives, without a researcher manually importing data or rebuilding the analysis. For wave-based trackers, results flow through at field closure. For continuous trackers, the dashboard updates in near real-time as responses collect.
How is brand tracking analysis software different from social listening tools?
Brand tracking analysis software is survey-based: it collects structured data from representative samples to measure brand KPIs with statistical validity. Social listening tools monitor unstructured mentions across digital channels. The two serve different purposes and are often used together — survey data for rigorous measurement of brand health trends, social listening for real-time signal detection between waves.
Can I use these tools for multi-market brand trackers?
Most platforms on this list support multi-market tracking, but the depth varies significantly. Qualtrics, Forsta, and Displayr have the strongest capabilities for complex multi-market programmes with market-specific weighting and cross-market significance testing.
How do I automate my brand tracking workflow?
The key steps are connecting your data source directly to your analysis platform, saving your analysis and reporting template so it can be rerun on new wave data, and automating the output format so reports update without manual reformatting. For a full walkthrough, see our guide to automating brand tracking.
If you want to see how automated brand tracker dashboards work with your own data, try Displayr free.