
There are many survey platforms that do not come with their own built-in choice-based conjoint question type. This then poses the question of how to set the data up so we can analyze it. We will now take you from the experimental design stage to your analysis stage while outlining the correct data structure.
Setting up your experimental design
In this simple conjoint example, we wish to look at the meat, sauce, and bun preferences for burgers. We have used Displayr to generate a balanced design via Insert > More > Conjoint/Choice Modeling > Experimental Design. This is based on 10 questions (or tasks) per respondent, 3 alternatives and 3 attributes per question, and 100 versions in total.
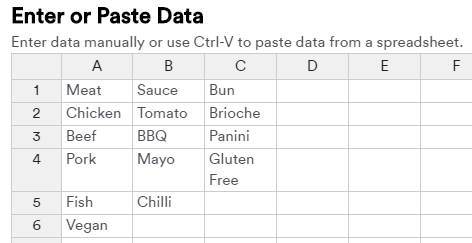
The options for the attributes (Meat, Sauce, Bun) have been pasted into the Add attributes and levels spreadsheet as below:
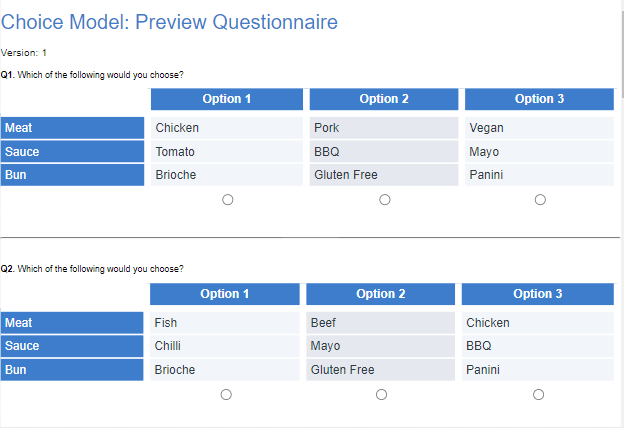
In the same menu, we can select Preview Choice Questionnaire to create a preview of your design. Below are the first 2 questions of version 1.
In the choice model output under Design, you will see the first 4 key columns: Version, Task, Question, and Alternative. The other columns represent the labels for the various items shown in each of the 3 attributes, Meat, Sauce, and Bun.
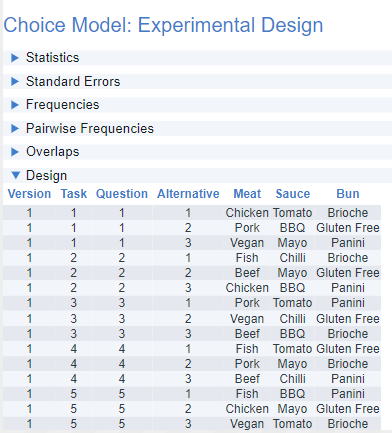
The 3 Alternatives correspond to the 3 columns in the questionnaire preview above i.e. Option 1, Option 2, and Option 3. Question will remain within the fixed 1 to 10 range. Task, though, is accumulative so the second version of the design will start from 11, the third from 21, and so on.
By simply clicking this output and selecting Export > Excel > Current Selection, you can export the design for programming in your survey platform.
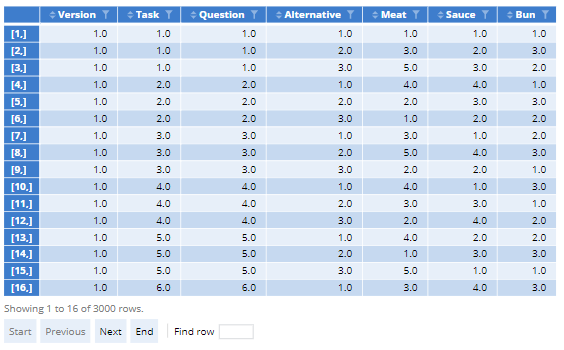
If needed, you can also generate a numeric version of the design via Inputs > DIAGNOSTICS > Numeric design.
If you are programming your survey in Qualtrics and have API access, you can export your design directly into your survey via the Export Design to Qualtrics option.
Setting up your respondent data
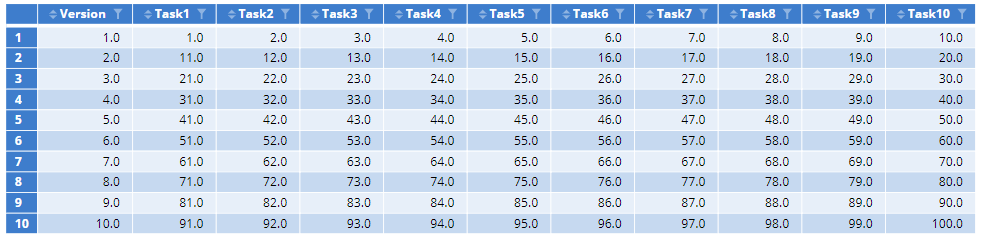
In preparation for data collection, you should pre-program the necessary variables into your survey. Below you will see the key conjoint fields for matching with our design. This is from the first 10 records of the burger survey. Here, we have recorded both the Version number and the task number for each Question. The Version number is sufficient, however, if the task order is unchanged from the design order.
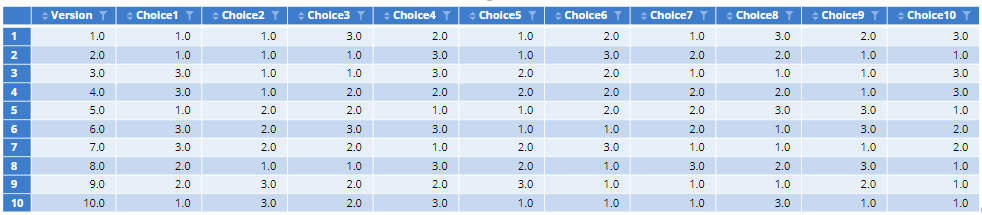
The format of the Alternatives selected in the survey is one variable per task corresponding to the 3 columns on display. This should either be Numeric or Categorical to ensure they are read correctly. You can convert text variables by changing INPUTS > Structure to Numeric.
If you have a ‘None of these’ option you will need to code this response as 0 or set Missing Values to Exclude from analyses. When importing labeled designs from Excel as a data set, you should, therefore, check the variable values. If you additionally ask a dual-response ‘None of these’ question after each task, you will also have the same number of ‘Yes/No’ questions.
Selecting the correct source options for your model
Once data collection is complete, you will need to import the appropriate data files via Home > New Data Set. We will now go to Insert > More > Conjoint/Choice Modeling > Hierarchical Bayes to start analyzing our choice data.
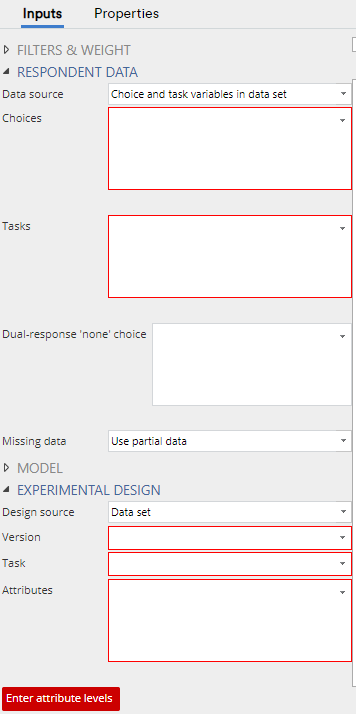
Under RESPONDENT DATA > Data source, you will be able to select Choice and task variables in data set or Choice and version variables in data set. When using the first option, ensure the task variables are in the exact same order as the choice variables. This is the same for when using the Dual-response ‘none’ choice field to select the ‘Yes/No’ questions. The second option allows you to simply reference the version variable if no task variables are supplied.
To input the matching design, under EXPERIMENTAL DESIGN > Data source select the appropriate option. In this case, we would select Experimental design R output as the design was created in Displayr. There are also options for Sawtooth and JMP files, and Displayr Experiment questions. The default Data set option is for all other externally created conjoint designs. When using a ‘data set’ option, the appropriate variables should be placed in their respective Version, Task, and Attributes fields.
Apart from when using Sawtooth CHO files (saved as .txt), Experiment questions, and Displayr designs, the other source options require one data set for the design and one for the responses. If your data comes from Alchemer (formerly SurveyGizmo), you will instead have a conjoint data set and a respondent data set. By going to Insert > More > Conjoint/Choice Modeling > Convert Alchemer (Survey Gizmo) Conjoint Data for Analysis, Displayr will append the choice and version variables to the respondent data set, provided ‘ResponseID’ appears in both files. For the design component, the ‘ResponseID’ from the conjoint data set is used as Version and ‘Set Number’ as Task.
For many of these options, there will also be an Enter attribute levels button at the bottom. This uses the exact same format as when we set up the design in a previous step.
Get in touch if you have any questions, and see our blog to keep up on all the latest Displayr features.