

What Are Survey Dashboards?
There’s more demand than ever for researchers to be performing surveys – but what’s the use of collecting survey data if you can’t tell the story behind it? Survey data dashboards are used by market researchers to transform results into insights. By adding interactive elements such as filters, stakeholders can use these dashboards to explore the data in a deep and personalized way.
A survey dashboard is a centralized, visual platform that consolidates all your survey data in one place, making it easy to interpret complex results at a glance. Instead of sifting through raw data or lengthy reports, users can quickly grasp key findings through charts, graphs, and other visualizations that highlight trends, patterns, and outliers. This enables faster, more informed decision-making and allows teams to identify actionable insights without advanced analytical skills.
Key Features of Survey Dashboards
Surveys have been a tool of researchers since the equivalent of the Dark Ages. But it’s always been difficult to visualize survey data and present it in a compelling way. With survey data dashboards, you can easily visualize and share key insights whenever you want – to whoever you want – in a whole new way. And the best dashboards all have a few things in common.
Some of the key features of effective survey data dashboards include;
- Real-time updates: Survey dashboards often update automatically as new responses are collected, ensuring that stakeholders always have access to the latest insights.
- Customized visualizations: Users can tailor the dashboard to display the most relevant metrics, using bar charts, pie graphs, line charts, and more to tell different stories from the data.
- Interactive Filtering: Dashboards allow users to segment data by demographics, time periods, or other variables, helping uncover deeper insights for specific groups or questions.
- Centralized Data Management: By bringing together results from multiple surveys, dashboards enable organizations to compare data sets and spot connections across projects.
- Collaboration and Sharing: Survey dashboards can be easily shared with colleagues or clients via web links or exports, democratizing access to critical information and encouraging collaboration.
How to Build Effective Survey Dashboards
Building effective dashboards requires some level of thought. Who is the intended audience? What are the main takeaways you want them to come away with? How do you best structure your dashboard so it tells a clear story?
Some of the main things to consider when trying to build great dashboards include;
- Planning: Before you even begin designing your survey data dashboard, you should think about the objectives you want the dashboard to achieve. This means everything from determining where the data comes from to determining if it needs automatic updating.
- Design: Dashboards should be designed for the end user. Think about your audience and how best to present them with survey data. By putting yourself in the audience’s shoes – or even sitting down with them – you can design the dashboard in a way that is informative and engaging.
- Tell a clear story: This doesn’t mean filling your dashboard with lots of visualizations and annotations – it means letting the data do the talking. Avoid clutter, use size and position to convey importance, and maintain consistency to help drive engagement.
- Select the right type of visualization: There are literally hundreds of different visualizations available to use in Displayr. And while it is great to have this level of flexibility, it is important to understand the best use cases for each specific chart type and how this matches up with your data. Scatter plots show the distribution of data, pie charts visualize composition. Knowing these subtleties will have you on your way to creating dashboards that wow.
Want to learn more? Learn the best practices for developing great dashboards.
Different Types of Survey Data Dashboards
- Brand awareness and health survey dashboards: A classic way of visualizing a survey of brand analysis on a market research dashboard is with a brand funnel. Brand funnels usually measure the awareness, familiarity, consideration, purchase, repeat purchase, and loyalty of customers for that brand.
- Product innovation survey dashboards: Product innovation survey dashboards are great for insight into future product development, pricing decisions, and potential future markets. It normally measures three metrics: usage intention, purchase intention, and willingness to pay.
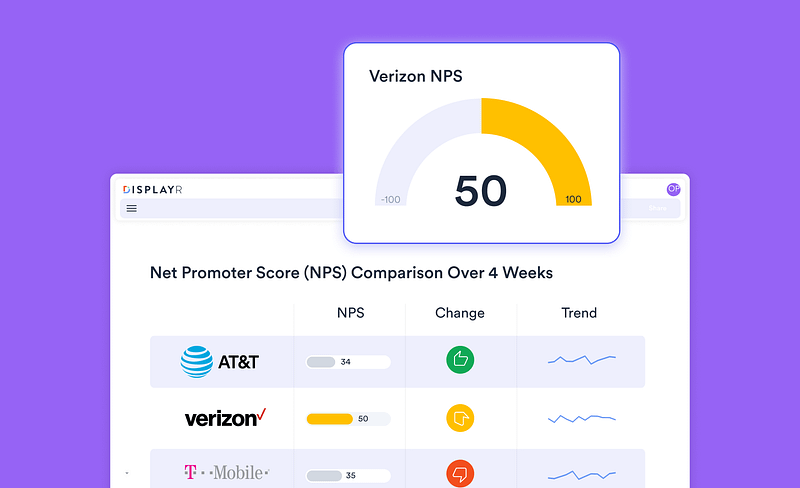
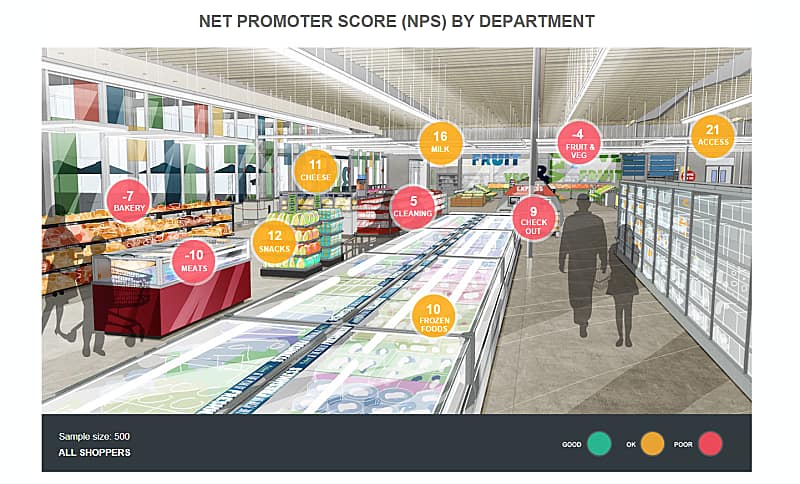
- Customer satisfaction survey dashboards: This market research dashboard surveys already existing customers and asks them about their experiences with a particular brand. One of the most popular metrics here is the Net Promoter Score (NPS), which evaluates customer loyalty by asking how likely a customer would be to recommend the product or service to someone else on a scale of 0-10. Ultimately, customer satisfaction measures the perceived quality of a product, the pricing, the design, and the customer service.
Why Choose Displayr to Create Your Survey Data Dashboards?
Displayr is the only complete analysis and dashboarding tool designed specifically to automatically interpret and format survey data. Need to visualize multiple response questions or a grid? Displayr has you covered.
It’s also simple enough to use so that everyone from the most advanced of analysts to relative newbies can perform statistical analysis, uncover trends, and unlock results without spending days wrangling SPSS or Excel and then PowerPoint. Just do it all in one tool.
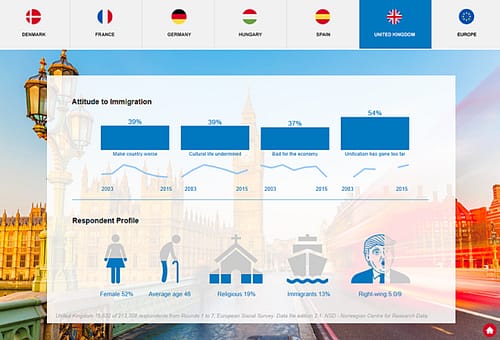
Displayr is also interactive. Need to zoom in and out of geographical regions’ data? Want to filter your survey for segments, demographics, or countries? Automate reporting for different regions? Hide labels with hover text? Displayr can do that and a lot more.
Export your dashboard to PowerPoint or PDF with one click and get ready for some seriously impressed colleagues and clients.
Ready to get started? Try Displayr for dashboarding for free today.