


Choosing conjoint analysis software in 2026 is harder than it was five years ago, not easier. Survey platforms have bolted conjoint modules onto their questionnaire tools, automated research suites sell it as one method among fifteen, the specialist vendors still price by quote, and general-purpose AI assistants now claim to run the analysis from a spreadsheet. Published prices run from free to five figures a year, and the method itself has not gotten any simpler: the experimental design, the estimation, and the simulator are still where studies succeed or fail.
For research teams that analyze and report conjoint studies, Displayr is the best option in that field. It generates the design, estimates the model with hierarchical Bayes or latent class, builds the client-facing simulator, and produces the report, with every step visible and editable. This guide compares it with seven alternatives on modeling depth, survey workflow, reporting, and fit for pricing and product research, and says where each of them is the better fit.
Best conjoint analysis software at a glance
| Software | Best for | Conjoint methods | Fields the survey | Published price |
|---|---|---|---|---|
| Displayr | Analysis, simulators, and reporting across any data source | CBC, HB, latent class, MNL, multi-class HB | No (design exports to Qualtrics, Alchemer, and others) | Free plan; Professional and Enterprise are per-user annual licenses |
| Sawtooth Software | Design depth and advanced conjoint types | CBC, ACBC, ACA, MaxDiff, menu-based | Yes | Discover free to 50 respondents; paid plans by quote |
| Conjointly | Self-serve studies with a built-in panel | Generic and brand-specific conjoint, MaxDiff, Gabor-Granger, Van Westendorp | Yes, with panel | Free (20 responses on advanced methods); $2,895/yr; Ultimate from $10,000/yr |
| Qualtrics | Teams already on Qualtrics | CBC only | Yes | By quote |
| quantilope | Enterprise automated research suites | Conjoint on Enterprise tier only | Yes, with panel | Business $2,300/mo; conjoint requires Enterprise (quote) |
| QuestionPro | Mid-market survey platform with conjoint built in | CBC, adaptive | Yes | Conjoint on higher tiers |
| OpinionX | Free and lightweight prioritization studies | Conjoint, MaxDiff, Van Westendorp, Gabor-Granger | Yes | Free to 25 participants; $900/yr unlimited |
| 1000minds | Adaptive pairwise trade-offs (PAPRIKA) | Adaptive pairwise, DCE | Yes | By quote; 15-day trial |
What conjoint analysis software does
Conjoint analysis software generates an experimental design of product profiles, presents choice tasks to respondents, estimates how much each attribute level drives choice (part-worth utilities), and turns those utilities into a market simulator that predicts share for any product configuration. Teams use it for pricing research, product and feature prioritization, and portfolio decisions. The hard parts are the design and the estimation, which is why the tools differ so much.
Can ChatGPT or Claude do conjoint analysis?
Not in a way a research team can stand behind. General-purpose AI assistants such as ChatGPT and Claude are genuinely useful around a conjoint study: drafting the attribute and level list, explaining the difference between CBC and adaptive designs, writing R or Python code, and summarizing results. What they cannot give you is an auditable model. Hand one a spreadsheet of choice data and ask for utilities, and the answer arrives without the design it assumed, the model it fitted, the priors it used, how respondents were weighted, whether the estimation converged, or how the share prediction was calculated. The numbers may be right but you’ll have no way to show how you got them.
Specialist conjoint analysis software exists to make every one of those steps visible. In Displayr, the experimental design is an object you can inspect and test for efficiency, the choice model shows its settings and diagnostics (including root-likelihood and holdout accuracy), weights are applied explicitly and can be switched off, and every utility and simulator output traces back to the design and model behind it. AI in Displayr does the setup work, generating the design, running the estimation, and building the simulator, but the result is a model you can open, check, and change, not a paragraph of text.
That matters more for conjoint than for almost any other method. A conjoint study is a chain of modeling decisions: design efficiency and prohibitions, whether price is numeric or categorical, the none option, HB priors, utility scaling, and calibration to real market share. Each one moves the share prediction, and a client who is about to set a price on the strength of a simulator will ask why the number is what it is. “The model said so” is not an answer. A design, a model summary, and a diagnostic are.
How we evaluated conjoint analysis tools
Conjoint has more ways to go wrong than any other quantitative method a research team runs regularly. We weighted four things:
- Modeling depth. Which conjoint types are supported (choice-based conjoint, adaptive CBC, MaxDiff, menu-based), which estimation methods are available (hierarchical Bayes, latent class, multinomial logit), and whether you can check the model rather than just accept it.
- Survey workflow. Whether the tool fields the survey itself, supplies a respondent panel, or exports the design to a survey platform you already use.
- Reporting and simulation. Whether the simulator is a feature or an afterthought, whether clients can use it without you, and how the results get into a deck.
- Fit for pricing and product teams. Support for price as a numeric attribute, willingness-to-pay outputs, and calibration to real market share.
1. Displayr: best for analyzing, simulating, and reporting conjoint data
Displayr covers the whole conjoint workflow except fieldwork. It generates the experimental design (efficient, partial profile, randomized, shortcut, and orthogonal designs, with prohibitions), exports the choice tasks to your survey platform, and then does the analysis and reporting once data is back. Estimation options are hierarchical Bayes (the default), latent class analysis, multinomial logit, and multi-class HB, with color-coded summaries that show which attributes and levels matter. AI handles the setup work: generating the design from your attribute list, running the HB estimation, and building the simulator.
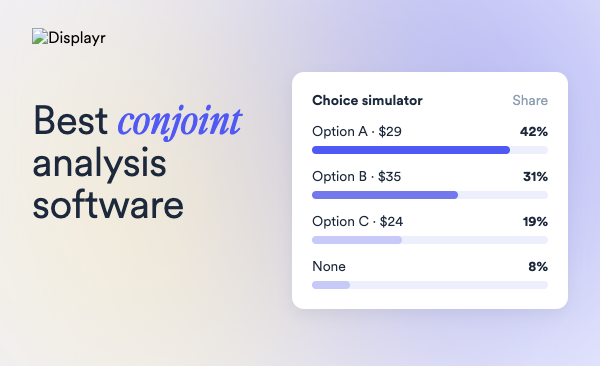
Where it stands out: the simulator and the reporting. Simulators are built in a couple of clicks, can be branded, password-protected, and shared with clients to run their own scenarios (see the choice simulator and fast food simulator in our dashboard examples), and the same project produces the crosstabs, dashboards, and PowerPoint reports the study needs. When a client asks why a feature scored the way it did, every utility and share prediction traces back to the design and model behind it. Displayr also imports conjoint data from Sawtooth, Qualtrics, and Alchemer, and in a root-likelihood comparison against Sawtooth’s HB the fit was equivalent.
The honest trade-offs: The free plan covers small data sets only.
Pricing: free plan; Professional and Enterprise are per-user annual licenses, with pricing shown in local currency on the pricing page.
Choose Displayr if your team analyzes and reports conjoint studies for clients or stakeholders, and especially if you already collect data in Qualtrics, Alchemer, or Sawtooth and want one place for the analysis, simulator, and deliverable. Its desktop sibling, Q Research Software, runs the same conjoint engine for analysts who prefer a Windows application.
2. Sawtooth Software: best for experimental design depth
Sawtooth Software has been the reference implementation of conjoint for over 30 years, and it still supports more conjoint variants than anyone else: standard CBC, adaptive CBC, adaptive conjoint analysis, MaxDiff, and menu-based designs. Lighthouse Studio is the Windows authoring tool for complex studies, and Discover is the web-based version for CBC and MaxDiff. All paid plans include HB estimation, simulators, and a latent-class segment finder.
The honest trade-offs: Lighthouse Studio is an expert’s tool with an expert’s learning curve, and the reporting stops at the simulator. Most teams take the utilities elsewhere for client deliverables. Pricing for Professional and Premier is by quote only.
Pricing: Discover has a free tier capped at 50 respondents per survey. Professional (Discover, unlimited respondents) and Premier (Lighthouse Studio with ACBC) are annual subscriptions by quote, with academic discounts available (Sawtooth pricing).
Choose Sawtooth if you run adaptive or menu-based designs, or your methodology team wants control over every design parameter. If you are looking for a Sawtooth Software alternative, the usual reasons are the Windows-only authoring, the quote-based pricing, or wanting the analysis and reporting in one place. Conjointly covers the first two and Displayr the third.
3. Conjointly: best self-serve platform with a built-in panel
Conjointly is the fastest way to go from an attribute list to a fielded study. The platform combines drag-and-drop experiment setup, a self-serve respondent panel, automated analysis, and a preference-share simulator that is included on every tier. Beyond generic and brand-specific conjoint it covers MaxDiff, Gabor-Granger, Van Westendorp, and Kano, which makes it a complete pricing research toolkit for teams without a methodologist.
The honest trade-offs: the modeling is automated rather than configurable, so there is less room to check or adjust the estimation. Reporting is built for the study, not for the wider deck.
Pricing: Basic is free with advanced methods limited to 20 responses. Professional is $2,895 per year. Ultimate starts at $10,000 per year. Self-serve sample is priced per response with a $0.55 minimum and a recent average of $1.55 (Conjointly pricing).
Choose Conjointly if you need a complete study, panel included, in days, and the deliverable is the study itself rather than a client report.
4. Qualtrics: best for teams already on Qualtrics
Qualtrics includes choice-based conjoint in its Strategy and Research suite. The design is randomized and balanced, exclusions are supported, and estimation is hierarchical Bayes implemented in Stan, running four chains of 1,000 iterations each. Outputs include individual-level utilities, feature importance, willingness to pay, and an interactive simulator. Qualtrics recommends two to eight features with two to seven levels each.
The honest trade-offs: CBC only, with no adaptive, MaxDiff-style, or menu-based variants, and no latent class. The attribute limits rule out larger studies. Licensing is enterprise-only and quoted.
Pricing: by quote.
Choose Qualtrics if your organization already licenses it and the study fits within eight attributes. If you want more control over the design or the estimation, you can build the choice experiment in Displayr and field it in Qualtrics, then analyze the results with any of the estimation methods above.
5. quantilope: best for enterprise automated research suites
quantilope is an automated advanced-methods platform. Conjoint is one of more than a dozen methods, delivered with an integrated panel and automated reporting that is designed for insights teams rather than methodologists.
The honest trade-offs: conjoint is only available on the Enterprise tier, so the entry price for conjoint is not the published Business price. Automation means less control over the design and the model.
Pricing: Business is $2,300 per month and does not include conjoint. Pro and Enterprise are by quote, and conjoint is an Enterprise feature.
Choose quantilope if you are buying a full automated research suite and conjoint is one method among many.
6. QuestionPro: best mid-market survey platform with conjoint built in
QuestionPro adds choice-based and adaptive conjoint to a general-purpose survey platform. Designs can be random, D-optimal, or imported, and the platform includes a market simulator, attribute importance, brand premium, and price elasticity reporting.
The honest trade-offs: the conjoint documentation does not describe the estimation method, so treat the outputs as a black box unless the vendor confirms otherwise. Conjoint sits on the higher tiers.
Pricing: conjoint is not on the entry plans. Check the current tier that includes it before budgeting.
Choose QuestionPro if you want one mid-priced platform for all survey work and conjoint is occasional rather than core.
7. OpinionX: best free conjoint analysis tool
OpinionX is a lightweight prioritization survey tool that includes conjoint, MaxDiff, Van Westendorp, and Gabor-Granger on every plan, including the free one. It is popular with product managers and startups who need a quick trade-off read rather than a full market model.
The honest trade-offs: the free plan caps each survey at 25 participants, which is far below the sample a real conjoint needs, and the analysis is simplified. No panel is included.
Pricing: free forever at 25 participants per survey. Analyze is $900 per year with unlimited participants.
Choose OpinionX if you need a quick internal or small-sample study and the budget is zero.
8. 1000minds: best for adaptive pairwise trade-offs
1000minds uses the PAPRIKA method, an adaptive pairwise approach in which respondents compare two options at a time and the software works out the trade-offs implied. It is widely used in health economics, prioritization, and multi-criteria decision-making as well as market research.
The honest trade-offs: it is a different method from choice-based conjoint, so it is not a drop-in replacement for a CBC pricing study. Pricing is by quote.
Pricing: by quote, with a 15-day free trial.
Choose 1000minds if your question is prioritization or decision weighting rather than market share simulation.
Free conjoint analysis software: what you actually get
Four of the tools above have a free tier, and each caps it differently:
- Sawtooth Discover: free to 50 respondents per survey, CBC and MaxDiff included.
- OpinionX: free to 25 participants per survey, all methods included.
- Conjointly Basic: free, but advanced methods stop at 20 responses.
- Displayr Free: analysis and simulators for small data sets.
None of these caps is enough for a commercial conjoint study, where a few hundred respondents is the usual floor. They are for learning the tool or piloting a design. For a genuinely free full-sample option, R has mature packages for choice modeling (such as mlogit and logitr) and HB estimation (ChoiceModelR), at the cost of writing the code and building your own simulator.
Which conjoint analysis software should you choose?
- You collect data in Qualtrics, Alchemer, or Sawtooth and report to clients: Displayr. One project for design export, estimation, simulator, and deliverable.
- You need a complete study with panel in days and no methodologist: Conjointly.
- You run adaptive, menu-based, or very large designs: Sawtooth Lighthouse Studio.
- You are already licensed for Qualtrics and the study is small: Qualtrics, or design in Displayr and field in Qualtrics.
- You want a quick trade-off read for free: OpinionX, up to 25 people.
- Your question is prioritization rather than share: 1000minds.
Frequently asked questions
What is the best conjoint analysis software?
For research teams that analyze and report conjoint studies, Displayr: it covers design, hierarchical Bayes and latent class estimation, simulators, and reporting in one project, with every step visible. Sawtooth Software leads on design depth and Conjointly on speed to field with a panel. For a free tool, OpinionX and Sawtooth Discover both have usable free tiers for small pilots.
How much does conjoint analysis software cost?
Published prices range from free tiers (OpinionX at 25 participants, Sawtooth Discover at 50 respondents) through Conjointly Professional at $2,895 per year, to quote-only enterprise licenses from Sawtooth, Qualtrics, and quantilope. Sample is extra on every platform, typically priced per response.
Is conjoint analysis the same as discrete choice modeling?
Choice-based conjoint is one form of discrete choice modeling: respondents choose between product profiles, and the model estimates how each attribute drives choice. Older conjoint methods used ratings or rankings instead of choices. Our guide to discrete choice modeling covers the differences and when each applies.
What is the difference between conjoint and MaxDiff?
Conjoint measures trade-offs between attributes with multiple levels, including price, and produces a market simulator. MaxDiff ranks a single list of items by asking for the best and worst in each set, and cannot model price trade-offs. Use conjoint for product and pricing configuration, and MaxDiff for prioritizing features, messages, or claims.
How many respondents does a conjoint study need?
There is no single number, because it depends on the number of attributes and levels, the number of choice tasks per respondent, and whether you need subgroup results. A few hundred respondents is the usual floor for a commercial CBC study, and the free tiers above (20 to 50 respondents) are for pilots only.
Can I run conjoint analysis in Excel?
Excel can hold the data and build a simple simulator from utilities, but it cannot generate an efficient experimental design or estimate hierarchical Bayes utilities. Every tool on this list exists because the design and estimation steps need dedicated software.
Conclusion
Conjoint analysis software splits into three kinds: tools that field the study (Conjointly, Qualtrics, QuestionPro, OpinionX), tools built around design depth (Sawtooth, 1000minds), and tools built around analysis and reporting (Displayr). Most research teams end up pairing one from the first group with one from the third. If the deliverable is a simulator and a report your client can use, start with the analysis end. Try Displayr free with your own conjoint data, see how it handles conjoint studies, or browse the conjoint examples in the dashboard gallery.