
How To Make A Table With Multiple Variables (Filters & Multiway Tables)
It is super-simple to create a table involving one variable in Displayr: just drag it from Data Sets (bottom-left) of the screen onto a page, and tables are automatically created. Making a table involving a second variable is also simple: drag a second variable on top of the table, releasing it in the Columns or By fields. Not surprisingly, many people […]
How to Create a Correlation Matrix in Displayr

A correlation matrix is a table of correlation coefficients for a set of variables. Correlation matrices are used to identify patterns of relationships between variables, as an input to other types of analysis (like PCA), and as a diagnostic tool for checking the results of an analysis. I’ll show you two easy ways to create […]
How to create a HEX color palette for Displayr
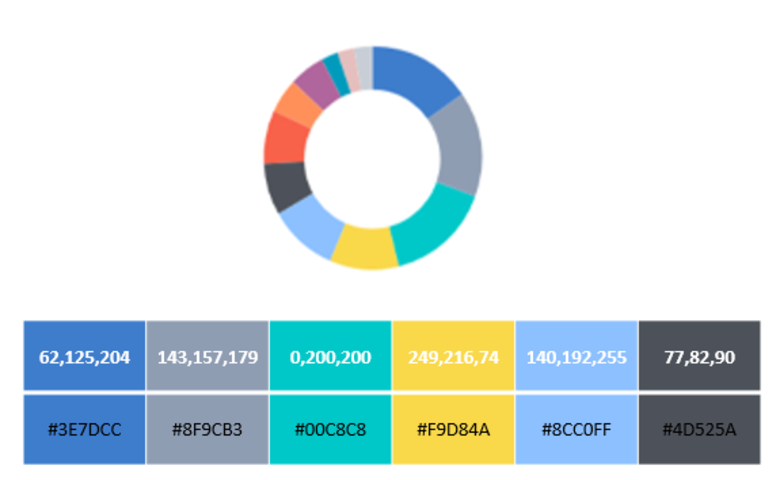
While most visualizations have built-in color palettes, more often than not you’ll want or need to customize them. Having a color palette set up BEFORE you start making a dashboard in Displayr will not only help you craft a beautiful dashboard, it will save you a lot of time in the long-run! We highly recommend […]
How to Control Who Can View your Documents in Displayr
If you need to restrict access to individual pages within a document, so that different groups of people see different pages when they log in to view, please read How to Control Who Can View Pages in your Document. The basic process for controlling who can view your documents is as follows: Create a User Group […]
How to Control Who Can View Pages in your Document
If you don’t need to control access to individual pages within your document, but just need to control access to each document, please read How to Control Who Can View your Documents in Displayr. The basic process for controlling who can view pages in your documents is as follows: Create a User Group for each level of […]
How to Embed a Video in a Displayr Dashboard
You can have a video playing on a page in Displayr, as it’s very simple to set up. The video needs to be hosted on the internet. If it is a proper site designed for hosting videos, it will have an embed code for the video. In the example below, we show how to embed […]
How to Control Who Can Edit Documents in Displayr
Each user in your account is a member of one or more user groups. Each document you create has settings which determine which users can edit or view the document. By creating user groups, assigning people to the right groups, and choosing which groups can access each document, you can control which of your users […]
Feature Engineering in Displayr
Feature engineering refers to the process of manipulating predictor variables (features) with the goal of improving a predictive model. In this post I outline some of the key tools and processes for feature engineering in Displayr. Switching between categorical and numeric treatment of predictor variables Perhaps the most fundamental form of feature engineering when building a predictive […]
How to Calculate Jaccard Coefficients in Displayr Using R
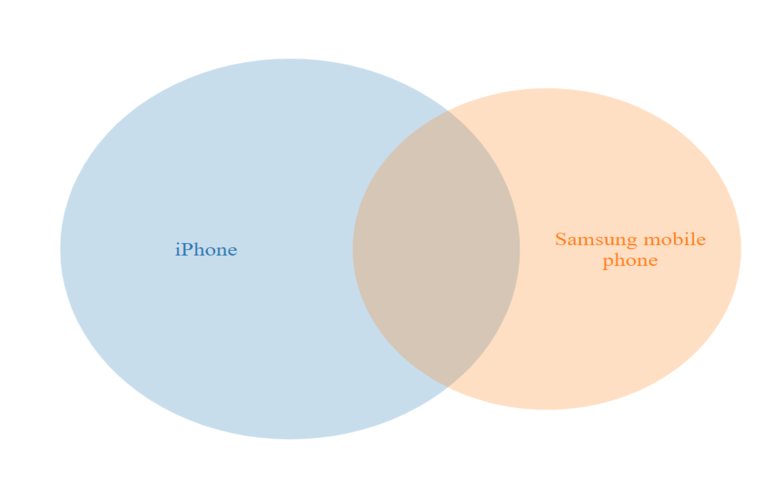
Jaccard coefficients, also know as Jaccard indexes or Jaccard similarities, are measures of the similarity or overlap between a pair of binary variables. In Displayr, this can be calculated for variables in your data easily by using Insert > Regression > Linear Regression and selecting Inputs > OUTPUT > Jaccard Coefficient. However, you can also […]
Seamlessly Analyze and Visualize your SurveyMonkey Data
SurveyMonkey is the world’s largest online survey tool. They help millions of users create and publish online surveys in minutes. While creating and sharing surveys is a breeze in SurveyMonkey, it can be a real pain to use it to analyze your survey data. Fortunately, Displayr has teamed up with SurveyMonkey to bring you the […]
How to Geocode IP addresses in Displayr

To demonstrate geocoding, we’ll use the IP addresses of the universities listed on this website. We are using universities because they each have a defined location, enabling us to check if this matches their geocoding. The first task is to convert URLs to IP addresses using DNS. The 25 IP addresses are listed below. If […]
How to Filter Data in Displayr
You can apply a filter in Displayr to any analysis, restricting it to a subset of interest. You can specify a filter when the document is in Edit mode as well as making it available for end-users of the document. These end-users can choose which filter groups to consider while in View mode. In this article […]
How to Display the Sample Size on an Online Dashboard
In Displayr, you can add a widget to your page which describes the sample size for the results you are presenting, as well as which filters are applied to the data. This allows your results to be understood at a glance, rather than leaving your viewers wondering “how many people are in this data?”, or […]
How to Calculate an Average Value from Categorical Data in Displayr
This requires that each category in the data be associated with a meaningful value, so that the average is also meaningful. In this post, we look at how to assign numeric values categories in Displayr so that averages can be calculated. Recoding To calculate the average value for a categorical question, a numeric value must be […]
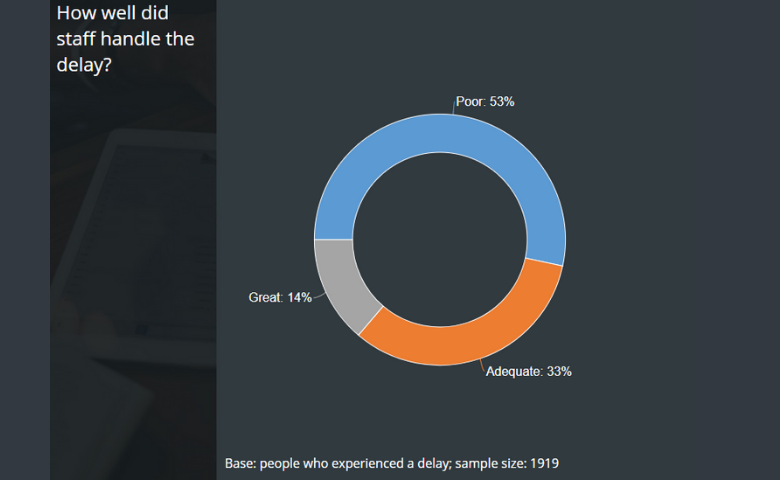
How to Create a Top 2 Box Score in Displayr
What is a Top 2 Box Score? A Top 2 Box score is a common means for reporting results of categorical scale questions in which the top two responses are combined. For example, we can use the following 5-point satisfaction scale: In this case, the first option in the scale (Extremely satisfied) is referred to […]
How to Calculate Penalty Analysis in Displayr
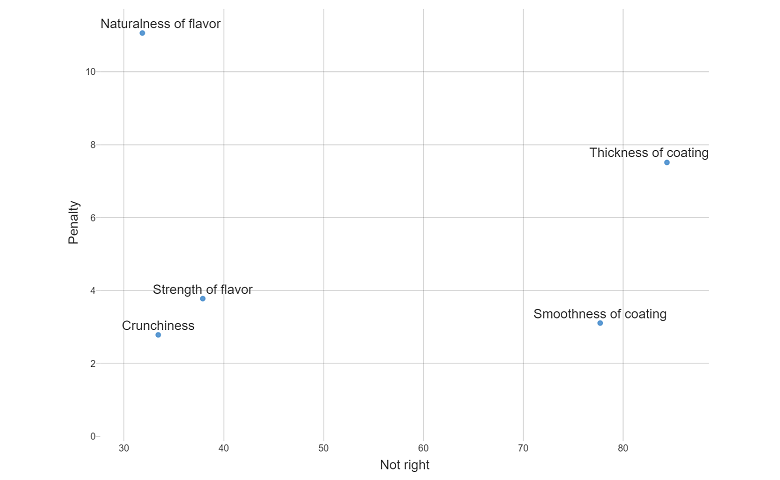
What is penalty analysis? Penalty analysis is a tool used to work out which attributes of a product have the greatest effect on how much people like it. For example, if our product is a chocolate cookie, which of these attributes – crunchiness, flavor, or coating effect – have the biggest impact on how much […]
Using Code to Automatically Update Text and Icons in Dashboards

Showing the date I am going to start with a very simple example, and then build up to more complex ones. To make Displayr show today’s date: Press Insert > R Output (Analysis), which is in the ribbon at the top of the screen. Type Sys.Time() into the R CODE box in the Object Inspector (on the […]
How to Upload and Read an Excel file into Displayr

The first method is the easiest. But if you want to upload an Excel file containing more than a single table or use more advanced features such as automatic updating – you’ll need to know how to use the second and third method as well. Method 1: Add Dataset from your local computer All three […]
Querying data from Salesforce using Displayr and R
You can easily extract data from Salesforce.com using Displayr and the Salesforce.com API’s. In this post, we show you how to generate a Security Token in Salesforce which is then used in Dispalyr to create an API call. The API brings the Salesforce data into Displayr which can be then be analyzed and charted as […]
Case Study: Automatically Updating Interactive Time Series Dashboard
This is the third in a series of blog posts designed as a DIY training course for using Displayr. This post illustrates how to pull in finance and google trends time series data into a document so that they automatically update, turn them into cool interactive charts, and then lay everything out so it looks […]
Customizing Logos, CSS, HTML Headers, and Language in Displayr
In addition to the content and formatting that you use when creating a Displayr document, you can also: Customize the overall look of the off-page elements of the document, such as the appearance of the navigation, and how the document name appears. Customize the logo that is shown when people create a link to a […]
How to Create a Simple Dashboard in Displayr
How do you create a simple dashboard that is interactive without using code? This article shows you how to create a simple dashboard in minutes using a worked example in Displayr. You will learn how to import data, create and combine separate charts and visualizations into one dashboard, create and apply filters, and publish online. The […]
How to run Linear Discriminant Analysis in Displayr
This post is a step-by-step guide to how to do Linear Discriminant Analysis in Displayr. You can do this easily by using this LDA template! Just follow the instructions to create your own Linear Discriminant Analysis. If you are not familiar with Linear Discriminant Analysis (LDA), and want to learn more then, click here for an […]
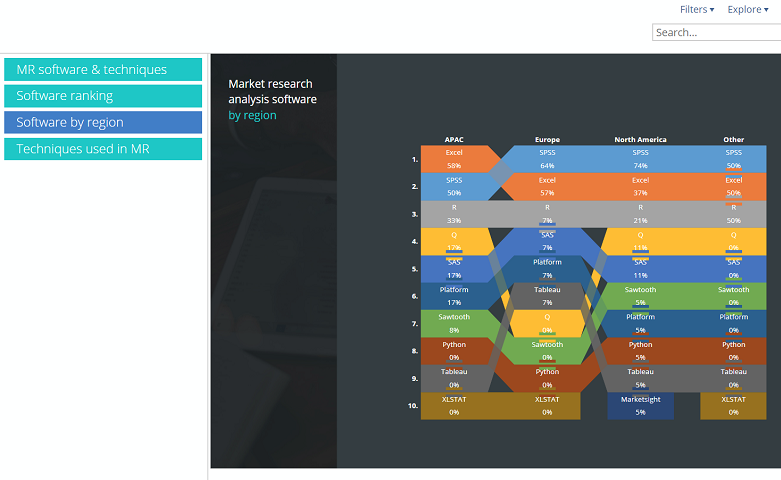
Displayr Dashboard Showcase
This post provides examples of different types of Dashboards created in Displayr. For each dashboard you can both view the dashboard in View mode (the mode seen by the end-users), and edit the dashboard in Edit mode, to see how it works. Microsoft KPI Overview: A one-page dashboard showing stock price and Google Trends data […]
Automatically Update Dashboards in Displayr
Dashboards and data can be automatically updated in Displayr. A key benefit of using Displayr, instead of traditional data science programs, is that it can be set up to schedule calculations to occur automatically, which will then automatically update a dashboard. The automatic updating of data. Automatic publishing of online documents (i.e., dashboards). Finally, automatic […]
An Overview of Displayr for Excel Users
It will not be immediately obvious, but Excel is a key inspiration for the design of Displayr. However, when you jump into Displayr you will be struck more by the differences than the similarities. In this post I compare how Displayr works relative to Excel. This post is written with advanced Excel users in mind. If you […]
10 Ways to Create New Variables in Displayr

Most data scientists have pretty clear picture of how variables should be created – and it almost certainly involves writing code. While you can take this approach in Displayr, there are often much smarter ways. By “smarter”, I mean faster and less error prone. Recap: What is a variable? And a derived variable? Just in case you […]
Introduction to Displayr 2: Getting Your Data into Displayr
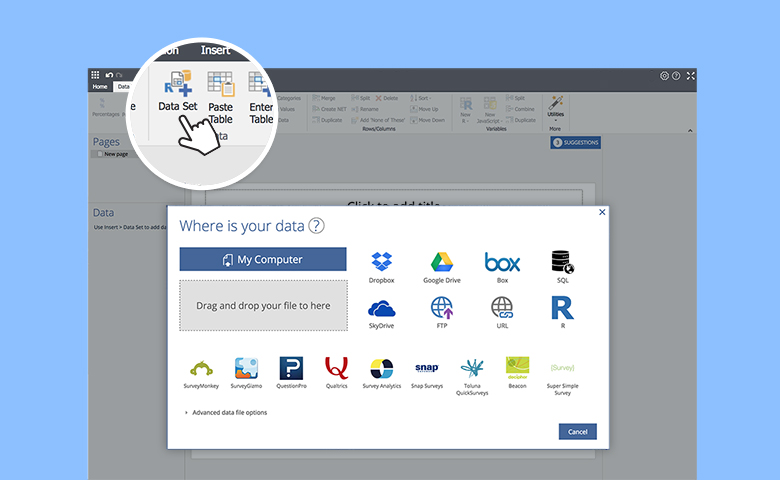
There are lots of ways to get your data into Displayr. They range from cutting and pasting, through to writing advanced data queries in SQL and R. In this blog post I will give an overview of all of them. However, in 99% of cases, the best approach is to either import a flat data file […]
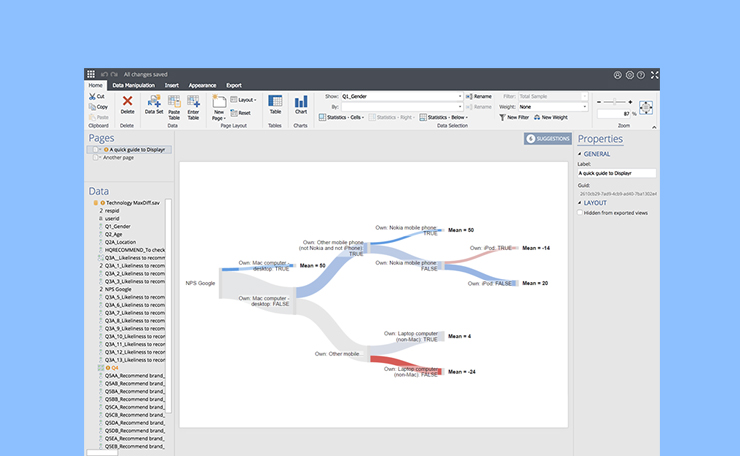
Introduction to Displayr 3: Creating Tables, Charts, and Other Visualizations

One of Displayr’s unique strengths is the creation and presentation of tables, charts, and other visualizations. This post give a quick overview of the different ways of creating such outputs. Creating summary tables with a single drag The table shown in the screenshot below was created with a single operation. I clicked on Data […]
Introduction to Displayr 4: Simple Calculations
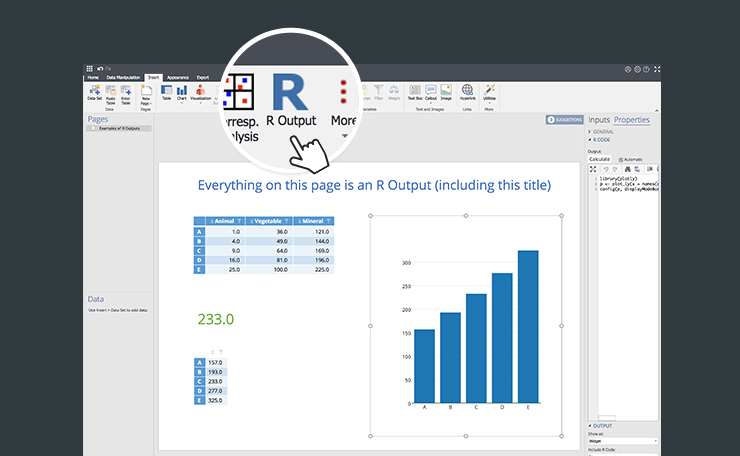
Once you have your data in Displayr, and have created some tables, the next step is to perform calculations using these tables as inputs. The results will be displayed in R Outputs. Introducing R Outputs An R Output is a type of calculation in Displayr. It has three defining properties: It is an output that appears on a page. […]
Introduction to Displayr 5: Machine Learning and Multivariate Statistics
This post gives a brief overview of how the more advanced data science analysis methods work in Displayr. Which advanced data science methods are available? There are too many to list. Seriously. Displayr allows users to perform analyses using R. R gives you access to, by far, the largest repository for advanced data science […]
Introduction to Displayr 6: Automated and Reproducible Reporting
This is the final blog post in our series introducing Displayr’s functionality. It focuses on reporting. Creating a report by exporting the document A Displayr document is in and of itself a report accessible by yourself and the team you work with. To share this with people outside your team, you can export the document. A […]
Understanding Variable Sets in Displayr: A Tutorial

Displayr has lots of tools designed to simplify data analysis. At the core of these tools is the concept of a variable set. The idea of a variable set does not exist in standard Business Intelligence or data analysis apps, and it is central to how Displayr works, so please be a bit patient and read this […]