
regression.

5 ways of presenting the results of key driver analysis techniques, such as Shapley Value, Kruskal Analysis, and Relative Weights.
Continue reading

In this post I describe how to quickly create a quad map in Displayr. The example uses a Shapley Regression to work out the relative…
Continue reading

Shapley regression has been gaining popularity in recent years and has been (re-)invented multiple times. However, relative weights, should be used instead.
Continue reading

Why is Multiple Linear Regression the standard technique taught for Key Driver Analysis when it gets it so wrong? The better method is Johnson’s Relative We
Continue reading

The variance inflation factor (VIF) quantifies the extent of correlation between one predictor and the other predictors in a model.
Continue reading

Learn about the removal of outliers from regression and how to correct rogue observations for accurate model results.
Continue reading

Understand logistic regression coefficients and how to interpret them in your analysis of customer churn in telecommunications.
Continue reading

Although PLS and Johnson's Relative Weights are both techniques for dealing with correlations between predictors, they give fundamentally different results.
Continue reading

Logistic regression is a type of regression analysis used when the dependent variable is binary (i.e., has only two possible outcomes).
Continue reading
Rather than just measuring one type of customer satisfaction, it's useful to measure these three aspects of customer satisfaction.
Continue reading

This is a practical guide to logistic regression. To get the most out of this post, I recommend you follow along with my instructions and…
Continue reading

Logistic regression (also known as binary logistic regression) is a predictive modeling technique used to predict outcomes involving 2 options. Learn more.
Continue reading
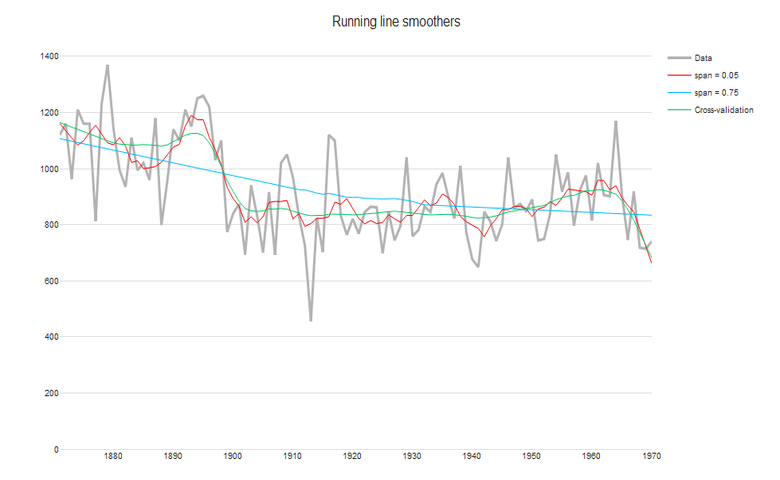
For time-series data, you'll want to separate long-term trends and seasonal changes from random fluctuations. Find out which time smoother to use.
Continue reading
Partial Least Squares (PLS) is a popular method for relative importance analysis in fields where the data typically includes more predictors than observations. Relative importance analysis…
Continue reading