
5 Ways to Visualize Relative Importance Scores from Key Driver Analysis

Key driver analysis techniques, such as Shapley Value, Kruskal Analysis, and Relative Weights, are useful for working out the most important predictor variables for some outcome of interest (e.g., the drivers of satisfaction or NPS). But, what is the best way to report them? In this post, I illustrate 5 ways of presenting the results […]
Creating Quad Maps in Displayr

In this post I describe how to quickly create a quad map in Displayr. The example uses a Shapley Regression to work out the relative importance, but the basic process described in this post can be used with any type of data. What is a quad map? A quad map is market research jargon for a scatterplot which […]
When to Use Relative Weights Over Shapley

Shapley regression is a popular method for estimating the importance of predictor variables in linear regression. This method can deal with highly correlated predictor variables that are frequently encountered in real-world data. Shapley regression has been gaining popularity in recent years and has been (re-)invented multiple times. In this blog post, I explain why a newer method, relative […]
Linear Regression Case Study | A Practical Guide

A key driver analysis investigates the relative importance of predictors against an outcome variable, such as brand preference. Many techniques have been developed for key driver analysis, to name but a few: Preference Regression, Shapley Regression, Relative Weights, and Jaccard Correlations. The best of the methods for regular day-to-day use of key driver analysis seems to […]
What Are Variance Inflation Factors (VIFs)?

What is the Variance Inflation Factor? The variance inflation factor (VIF) quantifies the extent of correlation between one predictor and the other predictors in a model. It is used for diagnosing collinearity/multicollinearity. Higher values signify that it is difficult to impossible to assess accurately the contribution of predictors to a model. How the VIF is […]
Automatic Removal of Outliers from Regression and GLMs

A well-known problem with linear regression, binary logit, ordered logit, and other GLMs, is that a small number of rogue observations can cause the results to be misleading. For example, with data on income, where people are meant to write their income in dollars, maybe one person writes their income as 50, meaning $50,000, and […]
How to Interpret Logistic Regression Coefficients

This post describes how to interpret the coefficients, also known as parameter estimates, from logistic regression (aka binary logit and binary logistic regression). It does so using a simple worked example looking at the predictors of whether or not customers of a telecommunications company canceled their subscriptions (whether they churned). If you’re new to regression […]
Comparing Partial Least Squares to Johnson’s Relative Weights

In this post I explore two different methods for computing the relative importance of predictors in regression: Johnson’s Relative Weights and Partial Least Squares (PLS) regression. Both techniques solve a problem with Multiple Linear Regression, which can perform poorly when there are correlations between predictor variables. When there is a very high correlation between two predictor variables, Multiple Linear Regression can lead to […]
What is Logistic Regression?

Logistic regression — also known as logit regression, binary logit, or binary logistic regression — is a type of regression analysis used when the dependent variable is binary (i.e., has only two possible outcomes). It is used widely in many fields, particularly in medical and social science research. Examples of situations where logistic regression can […]
Customer Satisfaction: General, Product, & Attribute Questions
General satisfaction A customer’s general satisfaction is their satisfaction with your brand or company as a whole. This is also known as their relational satisfaction, as it refers to a customer’s overall relationship with your brand. This is the measure that the American Customer Satisfaction Index (ACSI) uses in their annual reviews. The general Customer […]
How to do Logistic Regression in Displayr

This is a practical guide to logistic regression. To get the most out of this post, I recommend you follow along with my instructions and do your own logistic regression. If you’re new to Displayr, click the button below and add a new document! Step 1: Importing the data We start by clicking the + […]
How to Interpret Logistic Regression Outputs

Logistic regression, also known as binary logit and binary logistic regression, is a particularly useful predictive modeling technique, beloved in both the machine learning and the statistics communities. It is used to predict outcomes involving two options (e.g., buy versus not buy). In this post I explain how to interpret the standard outputs from logistic regression, focusing on those […]
Smoothing Time Series Data
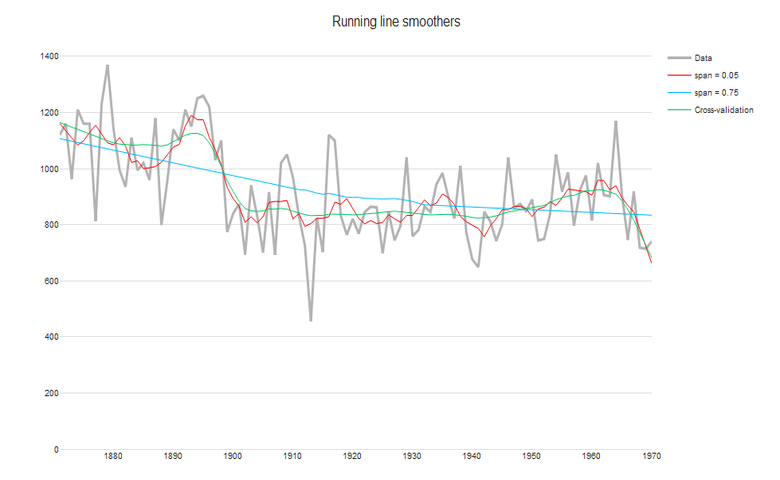
These include both global methods, which involve fitting a regression over the whole time series; and more flexible local methods, where we relax the constraint by a single parametric function. Further details about how to construct estimated smooths in R can be found here. 1. Global trends over time i. Linear One of the simplest methods […]
Using Partial Least Squares to Conduct Relative Importance Analysis in Displayr
Partial Least Squares (PLS) is a popular method for relative importance analysis in fields where the data typically includes more predictors than observations. Relative importance analysis is a general term applied to any technique used for estimating the importance of predictor variables in a regression model. The output is a set of scores which enable the predictor variables […]