
Learn More about Conjoint in Displayr

Introduction Conjoint Analysis: The Basics Main Applications of Conjoint Analysis Webinar: Introduction to Conjoint Design Experimental Design for Conjoint Analysis: Overview and Examples Writing a Questionnaire for a Conjoint Analysis Study Sample Size for Conjoint Analysis Algorithms to Create your Choice Model Experimental Design The Efficient Algorithm for Choice Model Experimental Designs The Partial […]
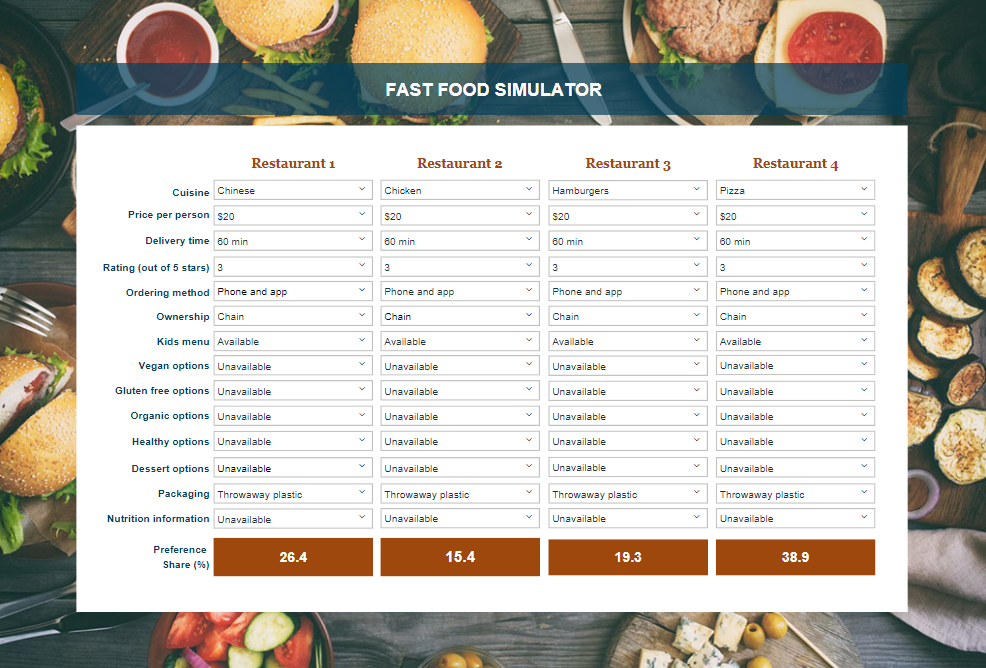
Optimizing your Conjoint Analysis Simulator in Displayr

The choice simulator is one of the main objectives of choice-based conjoint analysis. This allows you to predict the effect of different scenarios on preference or market share. For this case study, we have used the cruise ship data set which Sawtooth supplied in their 2016 modeling competition. This post assumes you have already created […]
Formatting Data for Running Conjoint in Displayr

There are many survey platforms that do not come with their own built-in choice-based conjoint question type. This then poses the question of how to set the data up so we can analyze it. We will now take you from the experimental design stage to your analysis stage while outlining the correct data structure. Setting […]
Using Choice-Based Conjoint in Pricing Research Studies
This one is a bit more complicated than the first five techniques we’ve talked about, but the idea of this technique is to find people’s preferences by providing them tradeoffs between a series of products and describing them based on certain attributes. For example, below is a question that compares several different cell phone providers […]
Using the Value Equivalence Line (VEL) with Conjoint Simulators
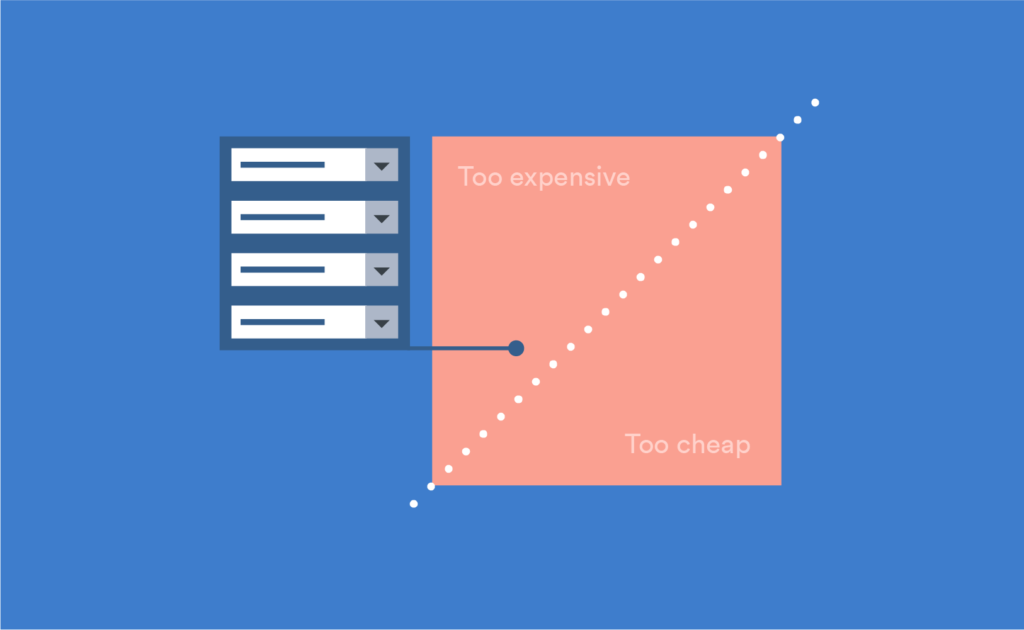
The value equivalence line is a useful concept for setting pricing strategies in markets where products vary in terms of their overall levels of benefits (e.g., quality levels). This post explains how the value equivalence line can be used in conjunction with a conjoint simulator to portfolios, illustrated using a study of the US cell […]
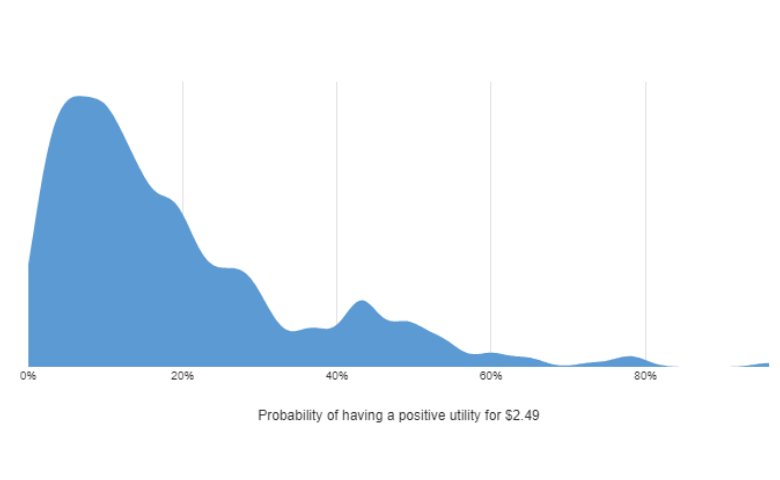
Computing Willingness-To-Pay (WTP) in Displayr

This post explains the basics of computing willingness-to-pay (WTP) for product features in Displayr. Step 1: Estimate a choice model with a numeric price attribute The starting point is to estimate a choice model (Displayr: Insert > More > Conjoint/Choice Modeling > Hierarchical Bayes; Q: Automate > Browse Online Library > Conjoint/Choice Modeling > Hierarchical […]
Creating Demand Curves Using Conjoint Studies

It shows how likely people are to make purchases at different price points. There are lots of different ways of estimating demand curves. In this post, I explain the basics of doing so from a conjoint study using Displayr. Example demand curve Below is a demand curve from a choice-based conjoint study of the chocolate […]
Reordering Attribute Levels in Conjoint Analysis Models in Displayr

The order of attribute levels in choice-based conjoint analyses are determined by their order in the experimental design file. This order is not always best from an interpretation perspective. In particular, it can be useful to reorder attributes so that the first category reflects the base case, and the remaining categories follow in some relevant […]
How to Analyze Dual-Response ‘None of These’ Conjoint Models in Displayr

In practical terms, the sample size is reduced in proportion to the frequency with which the “None of these” option is chosen. A way to prevent the sample size from being reduced is to show the “None of these” option in the choice questions, and then follow up each question with a Yes/No question asking […]
How to Check a Choice-Based Conjoint Model

Conjoint analysis, and choice modeling in general, is super-powerful. It allows us to make predictions about the future. However, if the models are poor, the resulting forecasts will be wrong. This post walks through the 7 stages involved in checking a choice model. The ‘hygiene test’: checking for convergence Most modern conjoint analyses are estimated […]
Comparing HB Root-likelihood (RLH) Between Displayr and Sawtooth
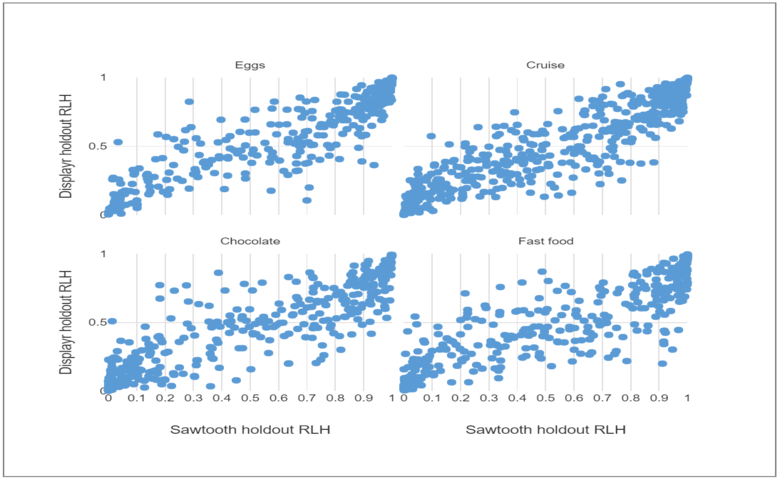
Root-likelihood (RLH) is a way to measure how well a choice model fits a data set. The RLH is a value ranging between 0 and 1, where a higher value indicates a better fit. It is less susceptible to noise than prediction accuracy but is less commonly used, perhaps because it is harder to conceptualize […]
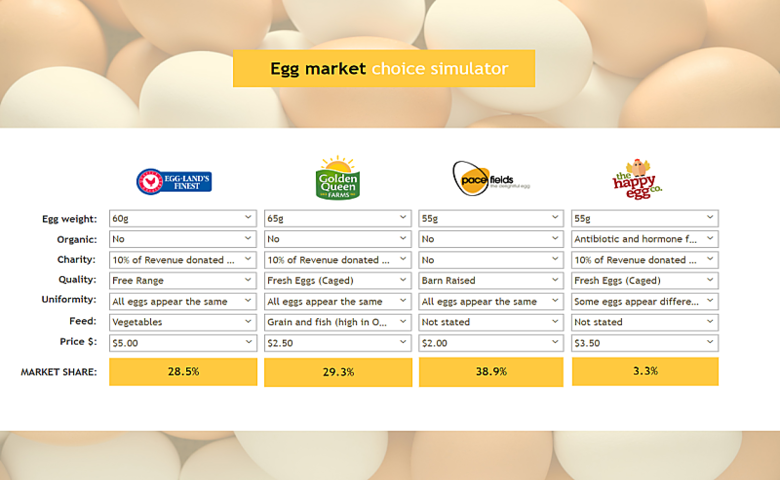
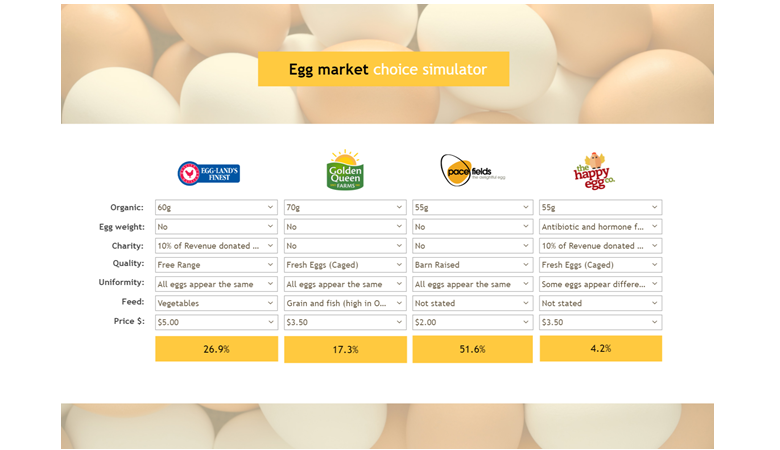
Creating Online Conjoint Analysis Choice Simulators Using Displayr
Creating the simulator Create a choice model of the conjoint using hierarchical Bayes (HB), latent class analysis or Multinomial logit in Displayr (Insert > More > Conjoint/Choice Modeling). You can also do this in Q and upload the QPack to Displayr. Click on the model and in the object inspector, click Inputs > SIMULATOR > […]
Adjusting Conjoint Analysis Simulators to Better Predict Market Share

This post describes four methods for adjusting choice simulators from conjoint studies so that they better fit market share: change the choice rule, modify availability, tuning the scale factor, and calibration. The post assumes that you have first created a simulator, as per the instructions in Creating Online Conjoint Analysis Choice Simulators Using Displayr and […]
Testing Whether an Attribute Should be Numeric or Categorical in Conjoint Analysis
Most choice-based conjoint (CBC) studies in marketing specify a fixed number of levels for each attribute. For example, a study of the fast food market could test a variety of prices — $10, $12, $15, $20, and $30 — and estimate the utility (or appeal) of each price point. However, in Economics it is more […]
Understanding Logit Scaling

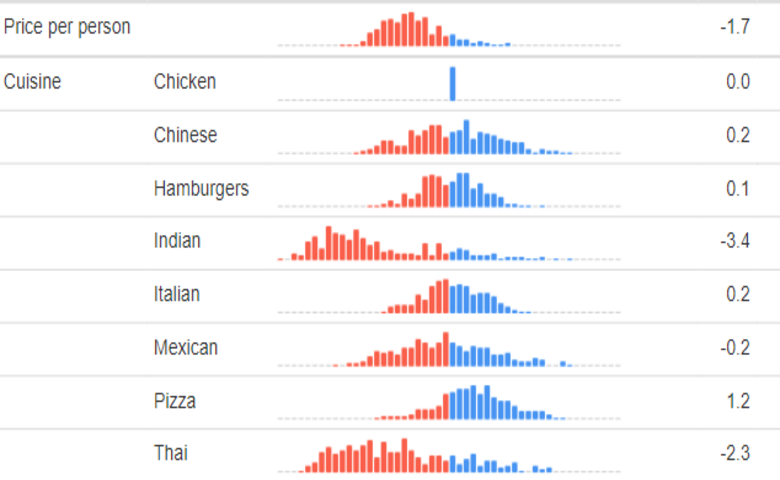
Example: choice-based conjoint analysis utilities Consider the utilities plot below, which quantifies the appeal of different aspects of home delivery. If you hover over the mouse plot you will see the utilities. For example, you can see that Mexican has a utility of 4.6 and Indian of 0. These values are logit scaled. Converting logit-scaled values into […]
Numeric Attributes in Choice-Based Conjoint Analysis in Displayr
Step 1: Set up and estimate the choice model treating all the variables as categorical Start by setting up the choice model keeping all the attributes as being categorical (see here for more info). Step 2: Duplicate the model In the Pages tree, click on the page that contains the choice model that was estimated in […]
Numeric versus Categorical Price Attributes in Conjoint Analysis
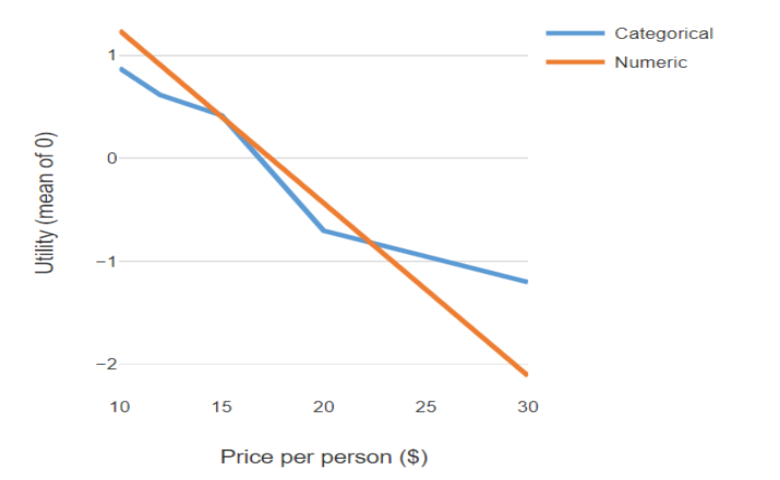
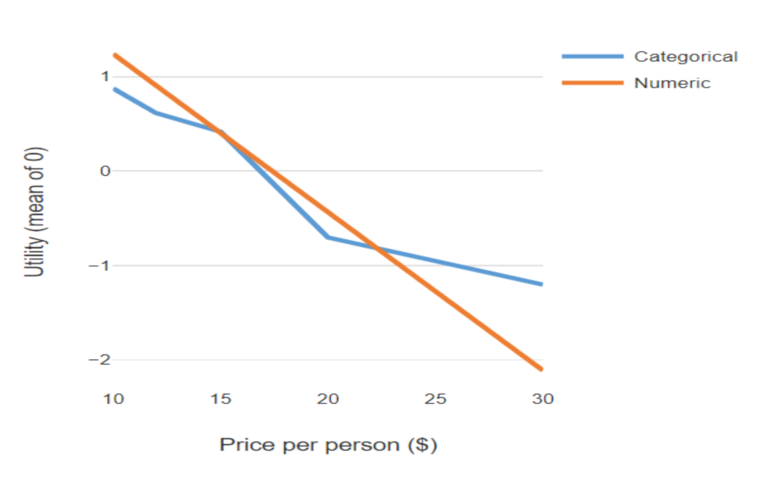
The difference between a numeric and categorical price attribute The chart below illustrates the the implications of treating price as being categorical versus numeric. When price is treated as a numeric attribute (variable), the model assumes that there is a linear relationship between price and utility, as shown by the orange line. When price is […]
Checking Convergence When Using Hierarchical Bayes for Conjoint Analysis
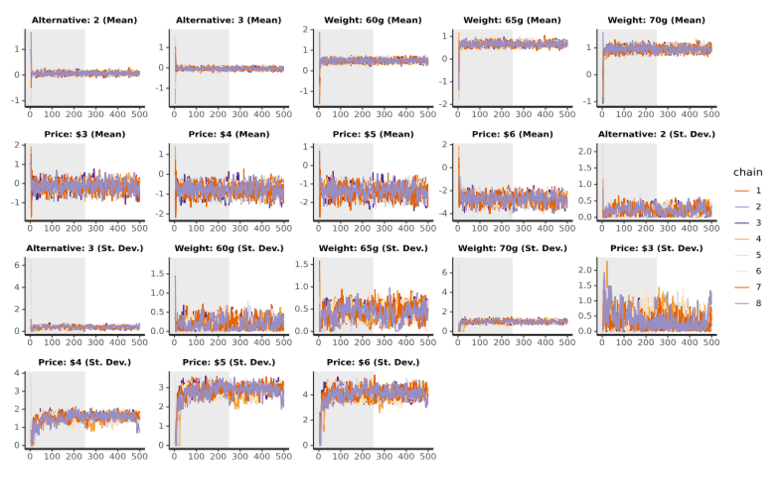
Please read How to Use Hierarchical Bayes for Choice Modeling in Displayr prior to reading this post. There are a number of diagnostic tools that you can use to check the convergence of the model. These include looking at the statistics of the parameter estimates themselves, checking trace plots which describe the evolution of the estimates […]
Performing Conjoint Analysis Calculations with HB Draws (Iterations)
Modern conjoint analysis methods estimate both the utilities of people, and also how much certainty we have about these estimates. Consequently, analyses of the resulting data should be performed in a way that takes into account this uncertainty. Fortunately, with hierarchical Bayesian methods (HB), this is quite simple. In this post I provide a worked […]
12 Techniques for Increasing the Accuracy of Forecasts from Conjoint Analysis

So, how accurate are choice experiments? Clients of choice experiments often request statements regarding the predictive accuracy of the technique. Unfortunately, only crooks provide such assurances. While many thousands of choice experiments have been conducted, the accuracy of only a handful have ever been published. This tells us two things: it is hard to assess […]
Experimental Design for Conjoint Analysis: Overview and Examples

This post introduces the key concepts in designing experiments for choice-based conjoint analysis (also known as choice modeling). I use a simple example to describe the key trade-offs, and the concepts of random designs, balance, d-error, prohibitions, efficient designs, labeled designs and partial profile designs. A simple example: brands and prices of cars In this […]
Data Visualization for Conjoint Analysis
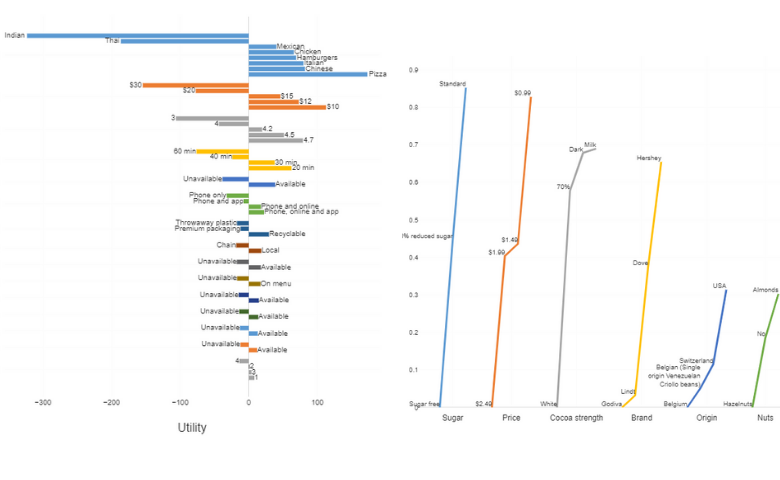
While choice-based conjoint analysis represents one of the more sophisticated techniques used in market research, presentation of its results commonly consists only of a simulator, and a few pie or bar charts. This leaves its users with only a limited understanding of the key patterns in the data. In this post I show key data […]
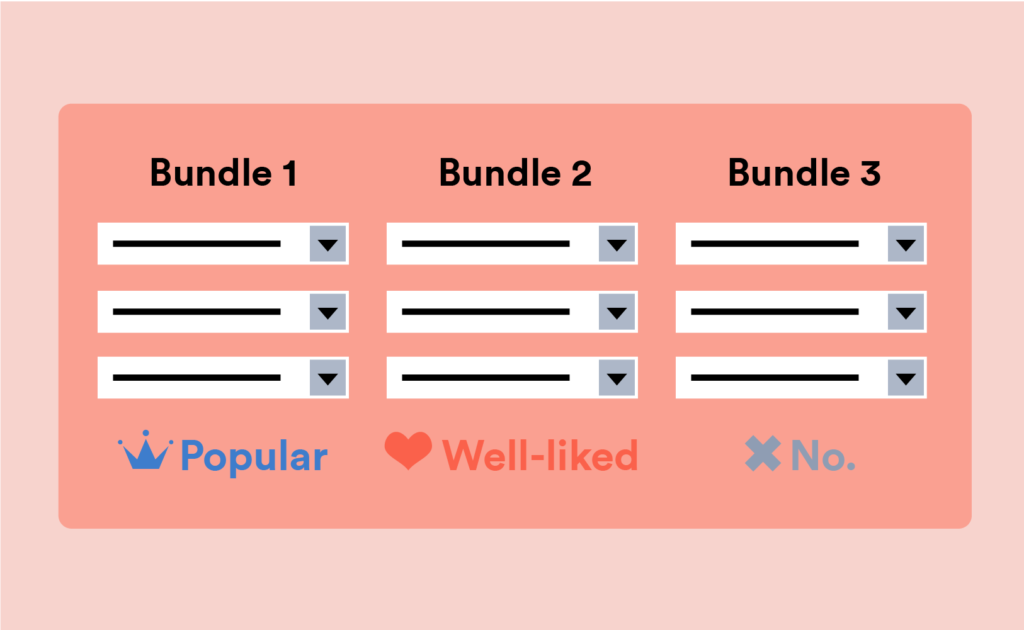
Using Substitution Maps to Understand Preferences in Conjoint Analysis

Modern tools for analyzing conjoint analysis, such as hierarchical Bayes, produce rich data showing preferences for each person in a market. The main deliverable from such research is a choice simulator. A practical challenge with choice simulators is that while they can answer any specific question, it is often hard to extract detailed insight from […]
Using Indifference Curves to Understand Tradeoffs in Conjoint Analysis
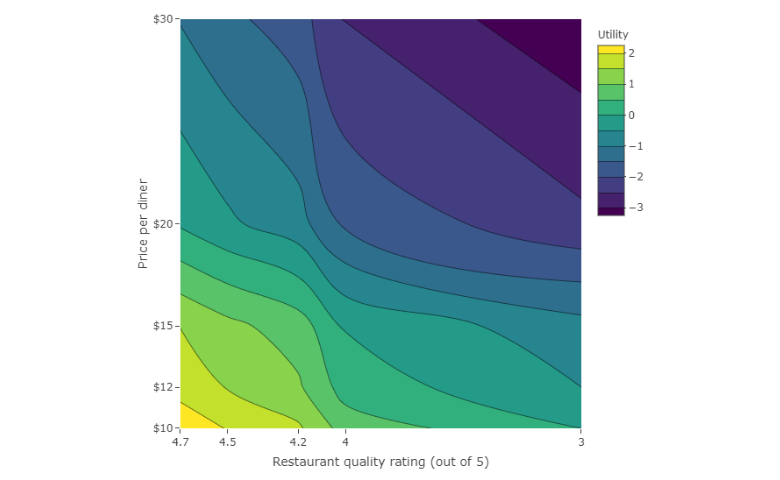
Indifference curves are a way of showing relative preferences for quantities of two things (e.g., preferences for price versus delivery times for fast food). This post shows how to compute indifference curves for conjoint analysis models. Example The contour plot below shows indifference between price and meal quality, from a choice-based conjoint study of home delivery preferences […]
Sample Size for Conjoint Analysis

Working out the sample size required for a choice-based conjoint study is a mixture of art and science. What makes it tricky is that the required sample size depends on a number of different things: The experimental design. The more alternatives in a question, the smaller the sample size that is needed. The more levels […]
Writing a Questionnaire for a Conjoint Analysis Study

The Screener The first section of a questionnaire generally contains the screening questions. These questions are used to determine if people are eligible for the study (e.g., are users of a particular product). They are used as well for collating quota information (i.e., ensuring an adequate cross-section of people in key sub-groups). For example, surveys […]
Main Applications of Conjoint Analysis
If you haven’t yet, check out “Conjoint Analysis: the Basics” for a primer on Choice-Based-Conjoint Analysis. Testing the appeal of a new product Choice-based conjoint analysis is widely used for testing the appeal of a new products and services. For example, a new flavor of soft drink, a new cabin in an aircraft (premium economy), […]
Conjoint Analysis: The Basics

Typical examples include: cost benefit analysis for planning new transportation options (e.g., new train lines), designing new cabins on airplanes (e.g., legroom, beverage, in-flight entertainment), creating new breakfast cereals, etc. (see Main Applications of Conjoint Analysis for more info). Choice-based conjoint analysis has lots of other names, and is variously known as choice modeling, stated […]
Comparing Choice Models and Creating Ensembles in Displayr

There are a variety of different models available in Displayr to perform Choice Modeling. In fact, Displayr is the best choice modeling software in world. And did we mention it is free? You can read about “How to do Choice Modeling in Displayr” here! In this post we firstly describe how to easily compare the […]
How to do Choice Modeling in Displayr

Selecting a choice model The first step is to choose the method used to analyse the choice data. The choice is between latent class analysis, hierarchical Bayes or multinomial logit. Hierarchical Bayes is more flexible than latent class analysis in modeling the characteristics of each respondent in the survey, so it tends to produce a model […]
How to Use Simulated Data to Check Choice Model Experimental Designs Using Displayr
Why use simulated data to check your choice model? You can generate choice model designs by using numerous methods with different specifications. Likewise, there are a variety of ways to check and compare them. The most common methods are D-error and design balance. However, these metrics do not directly measure how a design would perform […]
The Efficient Algorithm for Choice Model Experimental Designs

In this blog post, I describe the Efficient algorithm for generating choice model designs. The Efficient algorithm is actually a special case of the more general Partial Profiles algorithm. This algorithm is used for generating choice model designs with partial profiles, with no constant attributes specified. In another blog post, I found that the Efficient algorithm also performs better […]
The Partial Profiles Algorithm for Experimental Designs
In this blog post, I shall describe the Partial Profiles algorithm for generating choice model designs, which is described in a recent research paper (listed in the references). The paper finds that this algorithm outperforms other algorithms when their designs are benchmarked by the D-error metric. The Efficient algorithm is a special case of the Partial Profiles algorithm where no constant attributes are […]
How to Compute D-Error for a Choice Experiment Using Displayr
In other articles I provide the mathematical definitions of D-error and worked examples of how to calculate D-error; but in the real world, most people will use existing tools to compute D-error. In this article I describe how to use Displayr to compute the D-error for a choice experiment design. Preparing the design The design […]
How to Compute D-Error for a Sawtooth Software CBC Experiment

In other articles I provide the mathematical definitions of D-error and worked examples of how to calculate D-error; but in the real world, most people will use existing tools to compute D-error. In this article I describe how to use Q and Displayr to compute the D-error for a design from a Sawtooth Software CBC […]
How to Create Alternative-Specific Choice Model Designs in Displayr
What is an alternative-specific design? The most common example of an alternative-specific design is a transport choice experiment. In each question, respondents choose between alternative methods of travel to work, such as Walk, Drive and Bus. A typical question would be to choose between three alternatives, such as those shown below. Note that the attributes are different for […]
The Accuracy of Hierarchical Bayes When the Data Contains Segments

A simulation involving two segments To explore this problem I generated some simulated data for 200 fake respondents. I used a MaxDiff experiment with 10 alternatives (A, B, …, J) and 2 segments (75% and 25% in size). One segment was created to prefer the alternatives in order of A > B > … > […]
How to Use Hierarchical Bayes for Choice Modeling in Displayr

Getting started I’m going to assume you have some basic familiarity with Hierarchical Bayes (HB) and choice models, so I’ll be focusing on how we can do this in Displayr, the best choice modeling software in the world! We can fit a choice model by selecting Insert > More > Conjoint/Choice Modeling > Hierarchical Bayes […]
How Good is your Choice Model Experimental Design?

Defining Balance and Overlap Often, the quality of a design is described in terms of its balance and overlap. Balance is a measure of consistency of the frequencies of the attribute levels. Overlap is a measure of repetition of attribute levels within the same question. However, the drawback of these measures is that they produce […]
How to Create an Online Choice Simulator by Hand
The seven steps to create an online choice simulator are detailed in the post. In addition, an interactive example of a choice simulator is provided along with a tool to create your own choice simulator. The calculations for the choice simulator example are done using R, and the simulator is hosted in Displayr – which is […]